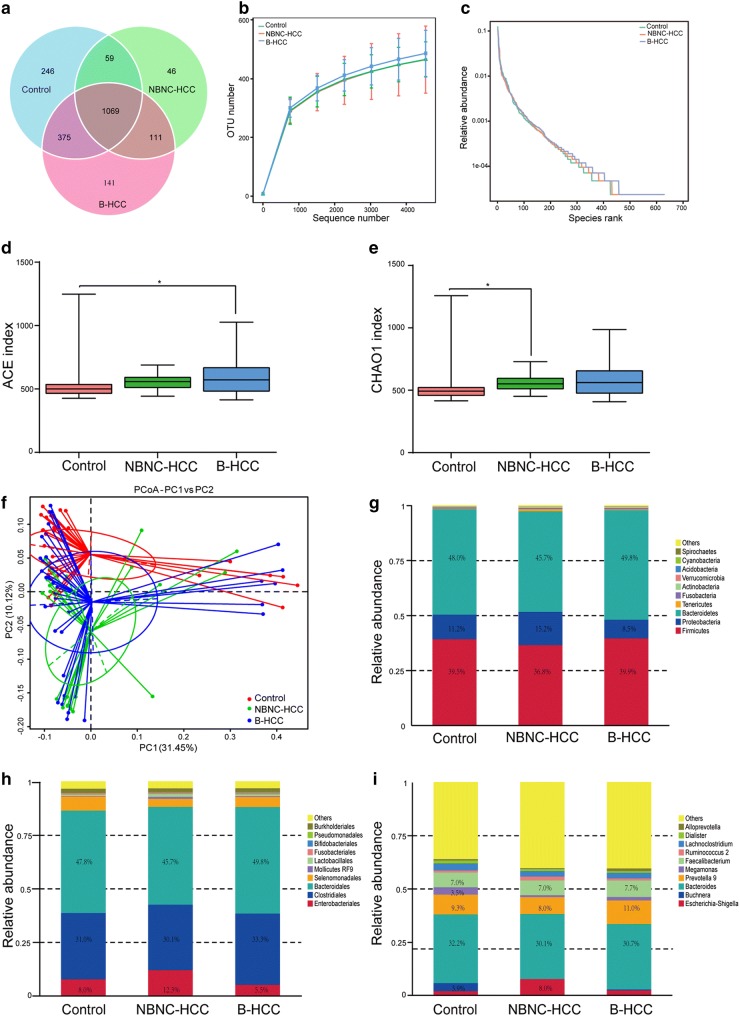
Fig. 1.
Shift microbiota and diversity in gut microbiota of healthy controls, NBNC-HCC and B-HCC patients. a Venn diagram of OTUs in three groups. b Observed species numbers in three groups. c Rarefaction curve for the comparison of OTUs in three groups. d, e Comparison of the alpha diversity (ACE and CHAO1) based on the OTUs profiles. f Principal Co-ordinates Analysis (PCoA) of bacterial beta diversity based on the unweighted UniFrac distances. Each node represents each sample. Control, NBNC-HCC and B-HCC subjects are colored in red, green and blue, respectively. g–i Relative abundance of the top 10 microbiota at the phylum, order and genus level

