Fig. 3.
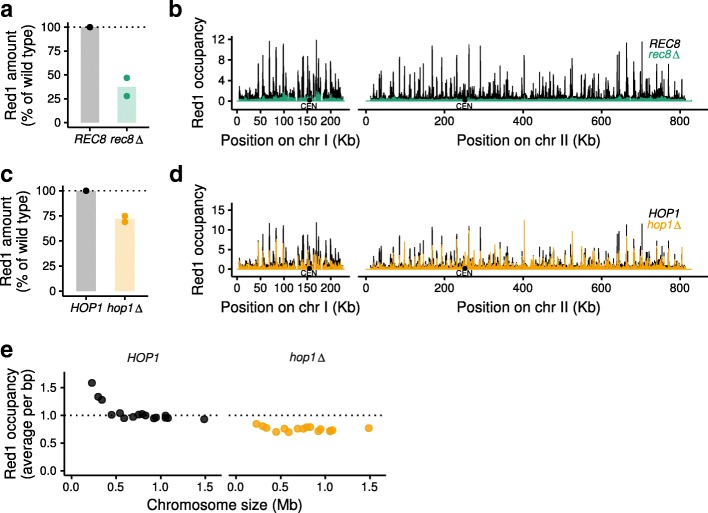
SNP-ChIP analysis in mutants with large-scale target redistribution. a Target protein Red1 levels in a rec8∆ mutant relative to wild type produced by SNP-ChIP. Points represent individual replicate values and bars represent average value. b Spike-in-normalized fragment pileups in wild type and rec8∆ mutant strains produced using MACS2 with SPMR (fragment pileup per million reads) sequencing depth normalization plotted on two example chromosomes. c Red1 levels in hop1∆ mutant relative to wild type produced by SNP-ChIP (as in a). d Spike-in-normalized fragment pileups in wild type and hop1∆ mutant strains (as in b). e Spike-in-normalized average Red1 signal on individual chromosomes in a hop1∆ mutant

