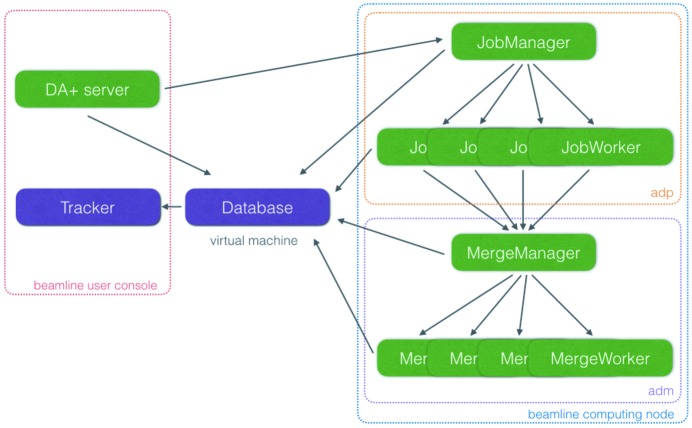
Figure 3.
Schematic representation of distributed DA+ daq and analysis software network. The beamline user console is delineated with a red dashed line and the beamline computing node with a blue dashed line. Adp and adm software utilities are outlined with orange and purple dashed lines, respectively.

