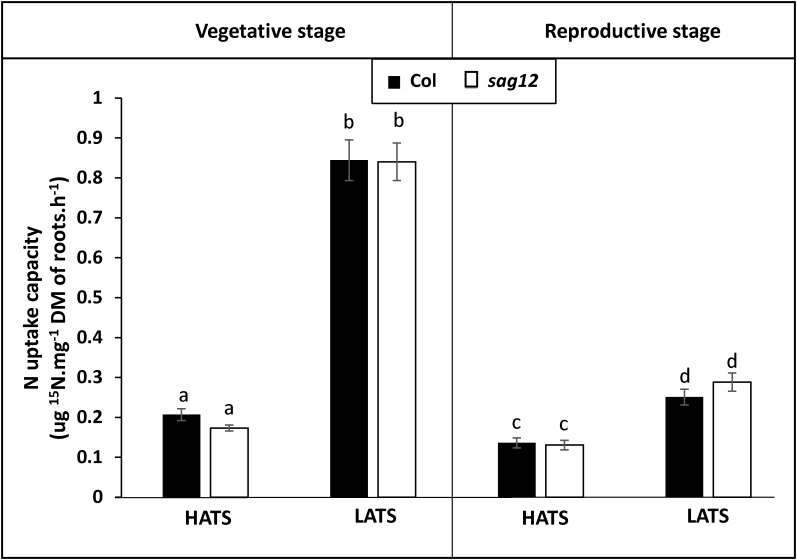
FIGURE 2.
Nitrogen uptake capacities by HATS and LATS are similar in Col and sag12. Col (black bars) and sag12 (white bars) plants were harvested at the vegetative (n = 12) and reproductive stages (n = 8). N uptake capacities by high (HATS) and low (LATS) affinity transport systems are presented as means ± SE. Different letters indicate statistically significant differences according to Student’s t-test (p ≤ 0.05).

