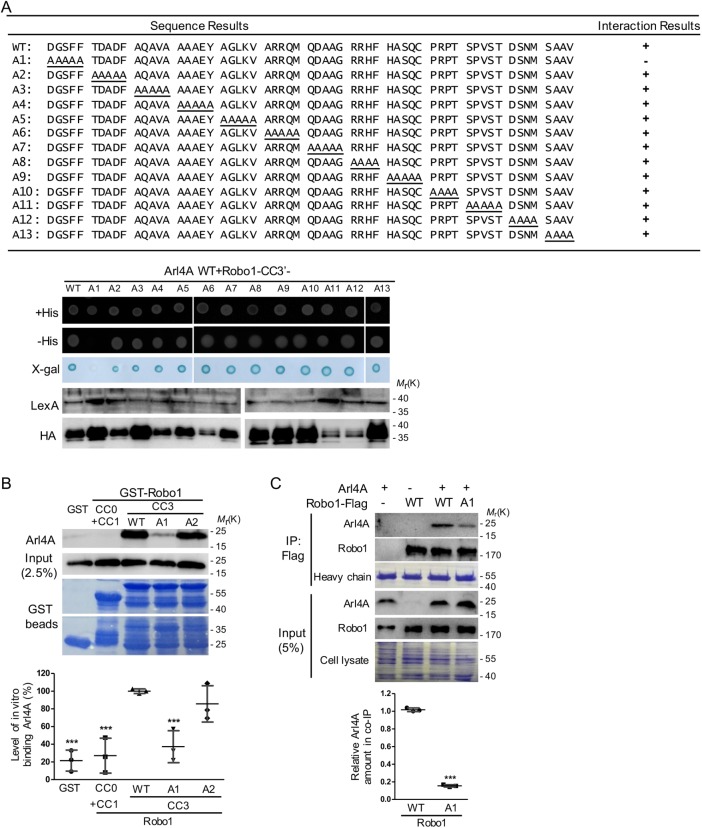
FIGURE 2:
A specific region in Robo1 is required for its interaction with Arl4A. (A) The region of Robo1 responsible for binding Arl4A was identified by a yeast two-hybrid system using fragments comprising amino acid residues 1370–1475 and Arl4A Q79L as the bait. Alanine scanning was used to determine which Robo1 fragments (from amino acid residues 1394–1454) were required for its interaction with Arl4A using a yeast two-hybrid system. Interaction between Robo1-WT and Arl4A-WT served as the positive control, and lamin was used as the negative control. (B) Direct interactions between Arl4A-WT and different Robo1 fragments were examined by an in vitro binding assay. His-tagged Arl4-WT was generated and purified from E. coli and then incubated with GST and four truncated/mutated GST-Robo1 genes (CC0+CC1, CC3-WT, CC3-A1, and CC3-A2) immobilized on glutathione–Sepharose beads, respectively. Bound proteins were detected by Western blotting, and Coomassie Brilliant Blue staining was used to ensure that equal amounts of GST and GST-Robo1 proteins were used in the in vitro binding assay. Arl4A signals were quantified based on in vitro binding assay data obtained from three biological replicates. The solid bars represent the mean ± SD. ***, P < 0.001 (one-way ANOVA with Dunnett's post hoc multiple comparison test, GST-Robo1-WT was used as the reference). (C) Interaction between Arl4A and Robo1-WT or Robo1-A1 was verified by in vivo coimmunoprecipitation. HeLa cells transiently transfected with the indicated plasmids were lysed and immunoprecipitated with anti-Flag M2 magnetic beads. The bound proteins were separated by SDS–PAGE and subjected to immunoblotting with antibodies against Arl4A and Robo1. To confirm the initial expression level, 5% of the total cell lysate (input) was loaded. Equal amounts of magnetic beads were used in the assays as shown by Coomassie Blue staining of the heavy chain. Co-IP assay data were quantified based on three biological replicates. The solid bars represent the mean ± SD. ***, P < 0.001 (Student's t test).

