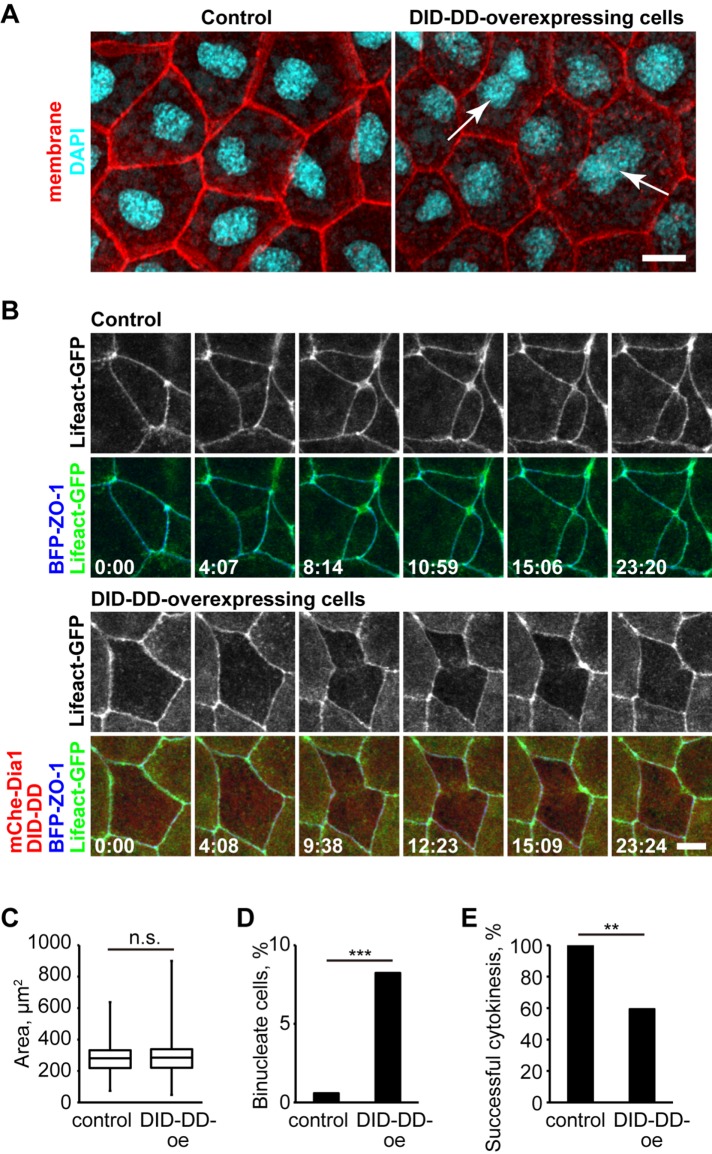
FIGURE 8:
Dia1 DID-DD–overexpressing cells exhibit cytokinesis defects. (A) Control (left) or mCherry-Dia1 DID-DD (right) embryos expressing GFP-farnesyl (membrane probe) were fixed and stained with anti-GFP (pseudocolored red) and DAPI (cyan). Note that there are binucleate cells (arrows) in Dia1 DID-DD–overexpressing embryos. (B) Live imaging of dividing cells in control (top panels) and Dia1 DID-DD–overexpressing (bottom panels) embryos using Lifeact-GFP (F-actin probe; green) and BFP-ZO-1 (TJ marker; blue). Note that in the Dia1 DID-DD–overexpressing cells, the contractile ring is formed and regresses over time. (C, D) Apical cell-surface area (C) and percentage of binucleate cells (D) in the fixed embryos (n = 171 cells from four embryos [control] and 170 cells from four embryos [Dia1 DID-DD]). (E) Success rate of cytokinesis in live imaging (n = 12 cells from three embryos [control] and 32 cells from three embryos [Dia1 DID-DD]). p values are 0.57 (C; t test), 0.00035 (D; Fisher's exact test), 0.0067 (E; Fisher's exact test). Scale bars: 10 µm.

