Figure 1.

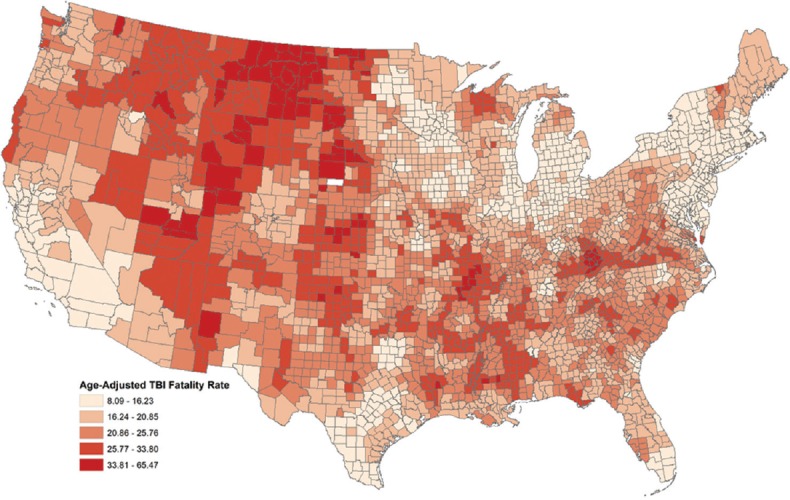
County traumatic brain injury fatality rate per 100,000 persons across the United States. The traumatic brain injury fatality rate is represented by color ramp, with higher values represented in red and lower values represented in tan

County traumatic brain injury fatality rate per 100,000 persons across the United States. The traumatic brain injury fatality rate is represented by color ramp, with higher values represented in red and lower values represented in tan