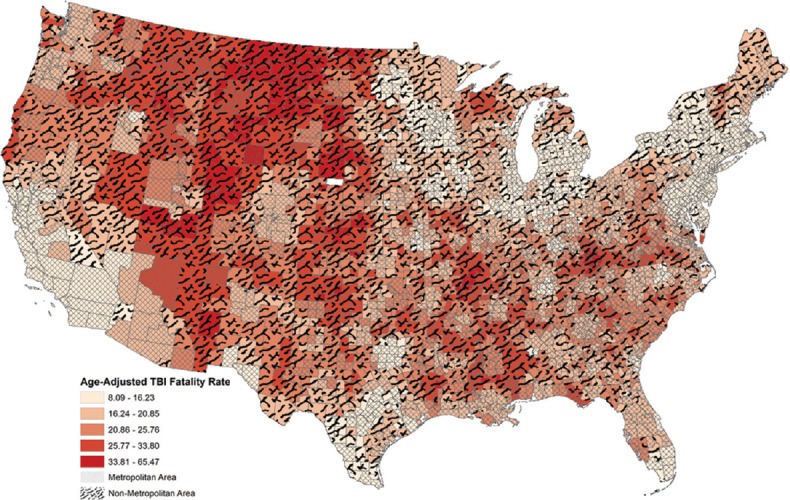
Figure 2.

County traumatic brain injury fatality rate per 100,000 persons across the US. Higher traumatic brain injury fatality rates are represented in red and lower values in tan. The black overlay pattern represents rural nonmetropolitan counties, and the light cross-hatch pattern represents urban metropolitan counties
