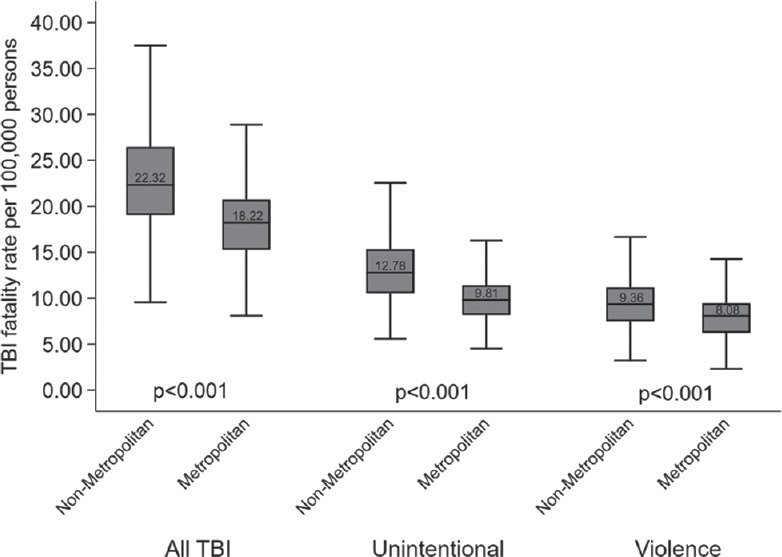
Figure 4.

Box plot of traumatic brain injury fatality rate per 100,000 persons comparing unintentional, violent, and all traumatic brain injury deaths in nonmetropolitan and metropolitan counties. Middle line represents the median rate. Ends of the box represent the 75th and 25th percentiles. Whiskers represent 1.5 times the interquartile range
