Figure 2.
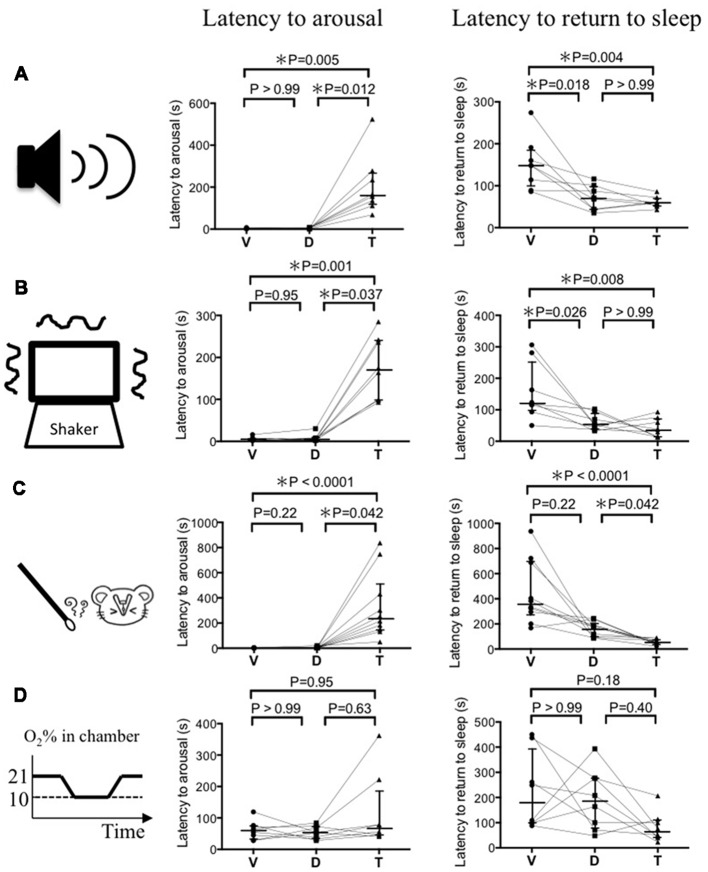
Latency to arousal and latency to return to sleep induced by four modalities of sensory stimulation. (A) Auditory stimulus by ultrasonic sound (n = 8). (B) Vestibular stimulus by cage shaking (n = 8). (C) Olfactory stimulus by a predator odor (n = 10). (D) Autonomic stimulus by hypoxia (n = 8). Each animal received vehicle (V), DORA-22 (D), and triazolam (T) in a randomized order on spaced days and were tested for one of the stimuli 2–3 times. The value from those tests were averaged and are represented as a single dot. Data from the same animal are connected with lines to show possible drug interactions within an individual animal. Horizontal lines indicate, from top to bottom, 75 percentile, median, and 25 percentile, respectively. Statistical results using the Friedman test, a repeated measure nonparametric multiple comparisons test, are indicated in the graph. Note that latency to arousal in DORA-22 treated mice is not different from those in vehicle treated mice and significantly shorter than those in triazolam treated mice, with the exception of hypoxia. Also note that latency to return to sleep in DORA-22 treated mice is significantly shorter than those in vehicle treated mice and not different from those in triazolam treated mice at least for auditory and vestibular stimuli.

