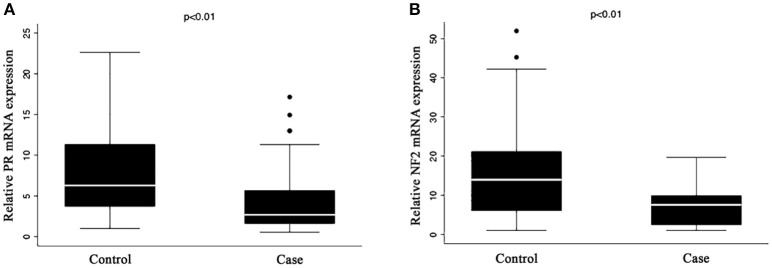
Figure 1.
Expression of (A) PR and (B) NF2 mRNA in serum. Quantitative RT-PCR analysis of mRNA expression for (A) PR and (B) NF2 in the serum of case and control group. The mRNA expression levels of PR and NF2 were normalized to the expression levels of GAPDH mRNA in each group. The results represent mean ± S. E. M.

