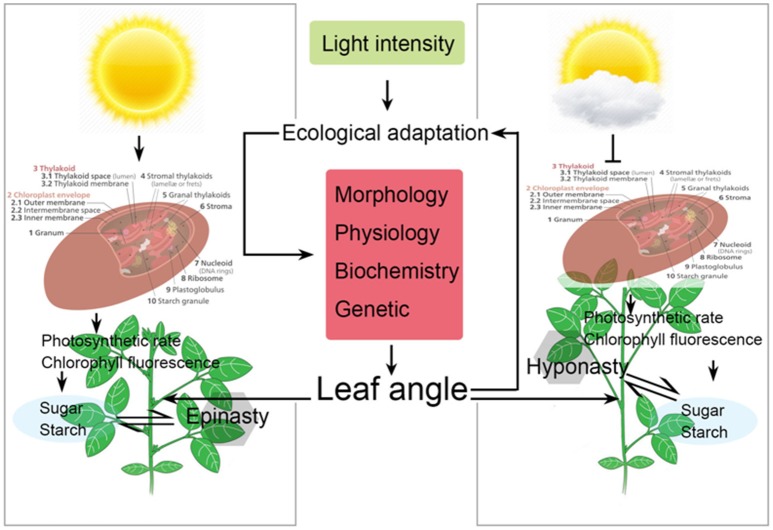
Figure 6.
Schematic representation of changes in leaf orientation (leaf angle), physiology, and photosynthetic characteristics of soybean plants as affected by different light intensity treatments. Arrows represent the regulating directions of light intensity on soybean growth and carbon synthesis in this paper. Suppression arrow represent that reduce light intensity which negatively affect the differential growth and carbon synthesis in soybean plants by reducing the chloroplast efficiency.

