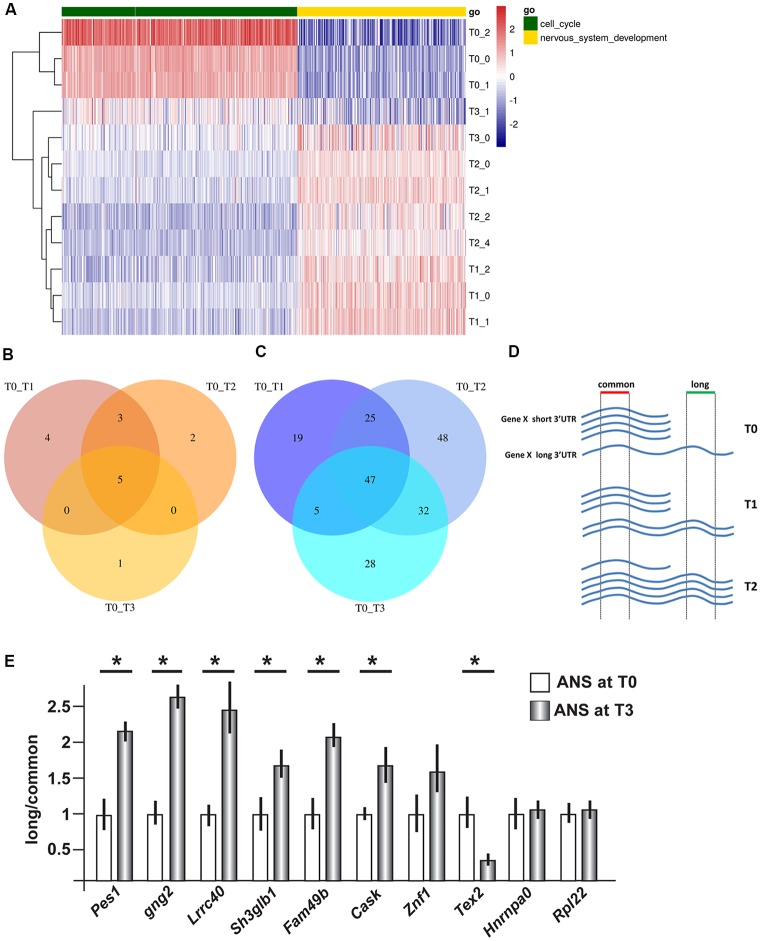
Figure 1.
Gene expression profiling and 3′ untranslated region (3′UTR) length in differentiating adherent neural stem (ANS) cells. RNAseq data were obtained from ANS cells at T0 (proliferating), T1, T2 and T3 (three timepoints of GABAergic differentiation). (A) Cluster analyses and heat Map of differentially expressed coding mRNAs, relevant to the control of cell cycle exit (in green) and early neuronal differentiation (in yellow). The color-code of the raw Z-scores is shown on the right. (B,C) Venn diagrams summarizing the number of transcripts showing shortening (B) or lengthening (C) during inhibitory neuron differentiation, comparing proliferating (T0) with differentiating (T1, T2, T3) ANS cells. (D,E) Technical validation of 3′UTR lengthening. A scheme illustrating the strategy used to quantify the relative abundance of the long vs. common forms of 3′UTR is shown in (D). Ten selected 3′UTRs were examined by Real-Time qPCR analysis (in E). Eight of them showed changes in the relative abundance consistent with the RNAseq data. See also Supplementary Tables S3A,B for a full list. *p < 0.05.

