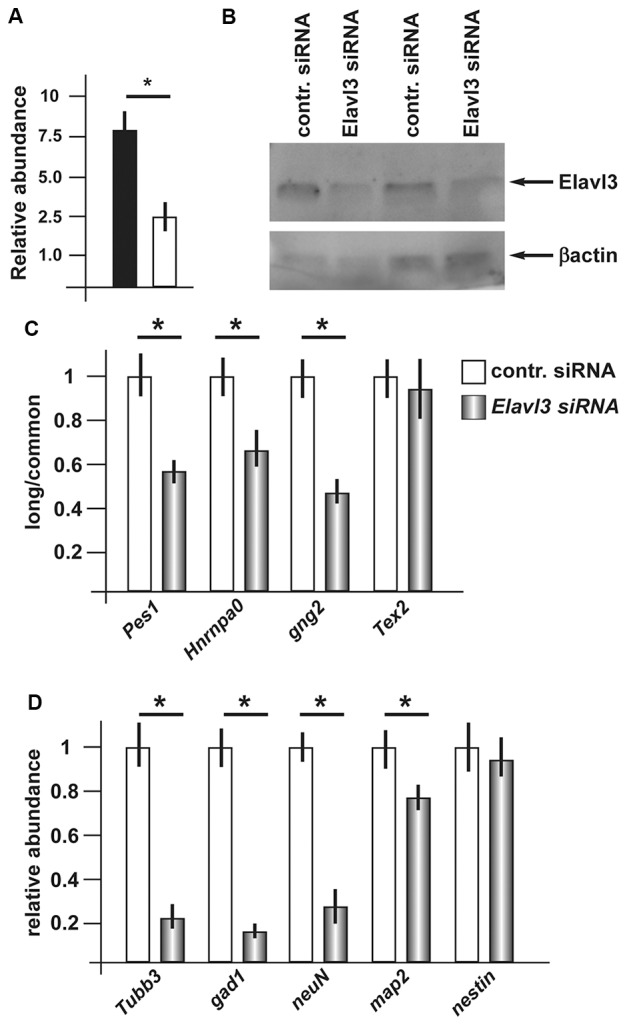
Figure 4.

Effect of depletion of Elavl3 in differentiating ANS cells. (A) RealTime qPCR analysis to detect the abundance of Elavl3 mRNA in ANS cells treated with the control (black) or anti-Elavl3 (white) siRNA. (B) Western blot analysis of ANS cells treated with the control siRNA or with the anti-Elavl3 siRNA, to confirm the downmodulation of Elavl3 protein (top). Staining with anti-actin on the same blot is used as loading control (bottom). (C) Real Time qPCR analysis to detect the relative abundance of the longer vs. the common variants of Pes1, Hnrnpa0, Gng2 and Tex2 mRNAs, comparing siRNA-treated vs. control-treated ANS cells, maintained in differentiation conditions. (D) Real-Time qPCR analysis to detect the mRNA abundance of the differentiation genes GAD1, Tubβ3, NeuN and Map2 in ANS cells treated with the control (black bars) or anti-Elavl3 (open bars) siRNA. *p < 0.05.
