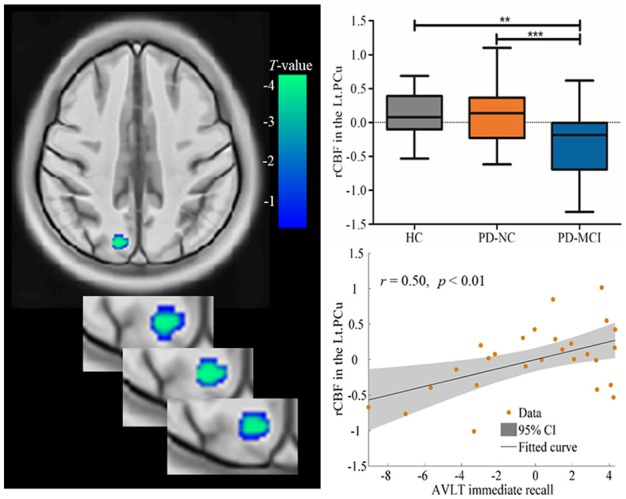
Figure 1.

Decreased rCBF values in the Lt.PCu specific to PD-MCI compared to HC and PD-NC. Box plots with Whiskers min to max show the rCBF values in the Lt.PCu in the three groups and scatterplots show the relationship between the Auditory Verbal Learning Test (AVLT) immediate recall performance and rCBF values in the Lt.PCu in patients with PD-MCI after controlling for education and depression score. rCBF, relative cerebral blood flow; Lt, left; PCu, precuneus; HC, healthy control; PD-NC, Parkinson’s disease with normal cognition; PD-MCI, Parkinson’s disease with mild cognitive impairment. **p < 0.01; ***p < 0.001.
