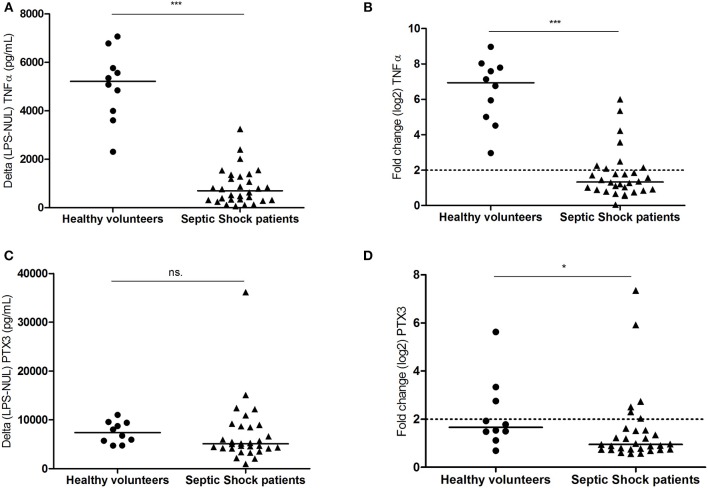
Figure 2.
Ex vivo whole-blood LPS-stimulation. Whole blood from 10 healthy volunteers and 30 septic shock patients stimulated ex vivo with LPS in Truculture® tubes for 24 h. Protein levels (A–C) and mRNA gene expression (B–D) are plotted for TNFα and PTX3. For cytokine quantification, results were expressed as the difference in cytokines production between LPS stimulated condition and unstimulated conditions (pg/mL). Counts number for mRNA gene expression, were normalized by the geometric mean of hprt1, decr1, and tbp housekeeping genes. The relative differential expression between LPS-stimulated and unstimulated condition was represented in the figure. Bar represents median. NS: not significant; *p < 0.05; ***p < 0.0001.

