Fig. 6.

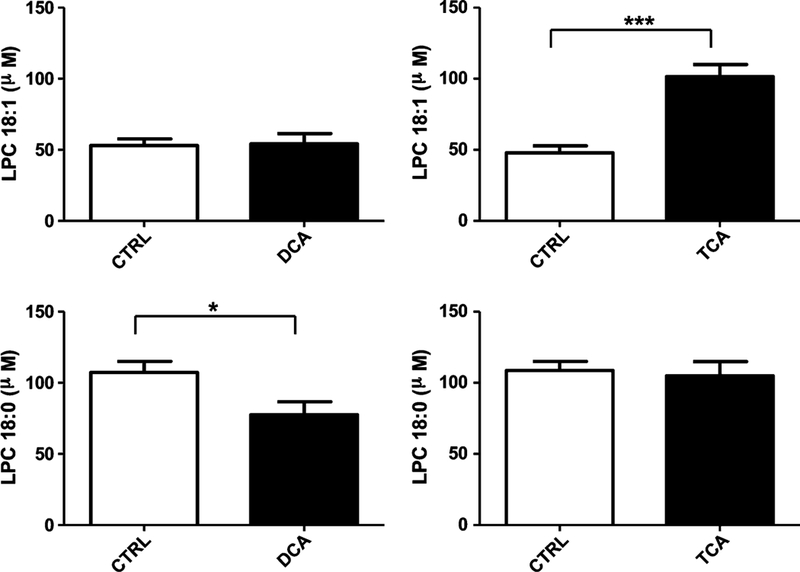
Quantitation of LPC(18:1,9Z) and LPC (18:0) in serum of control group, DCA- treated, and TCA-treated group. Each group contains five mice, and the data given as mean ± SEM (n = 5).*p < 0.05, **p < 0.01,***p < 0.001

Quantitation of LPC(18:1,9Z) and LPC (18:0) in serum of control group, DCA- treated, and TCA-treated group. Each group contains five mice, and the data given as mean ± SEM (n = 5).*p < 0.05, **p < 0.01,***p < 0.001