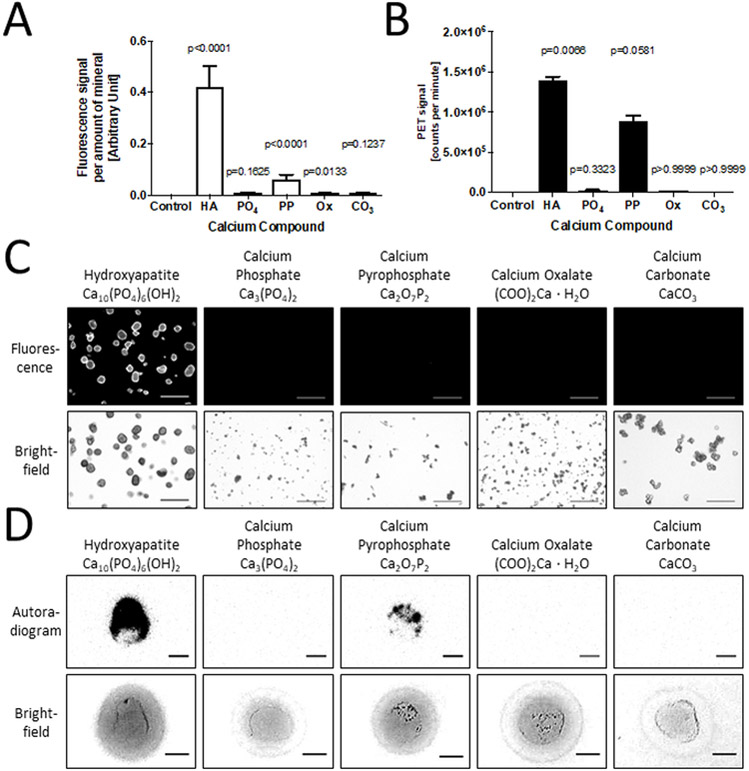
Figure 1. Affinity study of calcium salts with two markers for microcalcification - a near infrared fluorescence (NIRF) calcium tracer, and 18F-fluoride.
A, Signal quantification of NIRF tracer for individual calcium salts, and a Kruskal-Wallis test with Dunn’s multiple comparison test: Control – no mineral added (0.0±0.0, 0.0% of HA), HA – Hydroxyapatite (0.422±0.304, p<0.0001), PO4 – Calcium Phosphate (0.008±0.011, 1.8% of HA, p=0.1625), PP – Calcium Pyrophosphate (0.062±0.066, 14.8% of HA, p<0.001), Ox – Calcium Oxalate (0.006±0.008, 1.5% of HA, p=0.0133), CO3 – Calcium Carbonate (0.006±0.008, 1.5% of HA, p=0.1237). B, Signal quantification of radioactively labelled 18F-fluoride for different calcium salts, and a Kruskal-Wallis test with Dunn’s multiple comparison test: Control (0.007×10⁵±0.010×10⁵ CPM, 0.05% of HA), HA (13.9×10⁵±0.7×10⁵ CPM, p=0.0066), PO4 (0.27×10⁵±0.08×10⁵ CPM, 1.9% of HA, p=0.3323), PP (8.91×10⁵±0.94×10⁵ CPM, 64.0% of HA, p=0.0581), Ox (0.13×10⁵±0.01×10⁵ CPM, 0.9% of HA, p>0.9999), CO3 (0.006×10⁵±0.005×10⁵ CPM, 0.04% of HA, p>0.9999). C, Fluorescence images of different calcium salts after incubation with NIRF calcium tracer (scale bars, 100 µm). D, Autoradiograms of different calcium salts after incubation with 18F-fluoride (scale bars, 0.25 mm).

