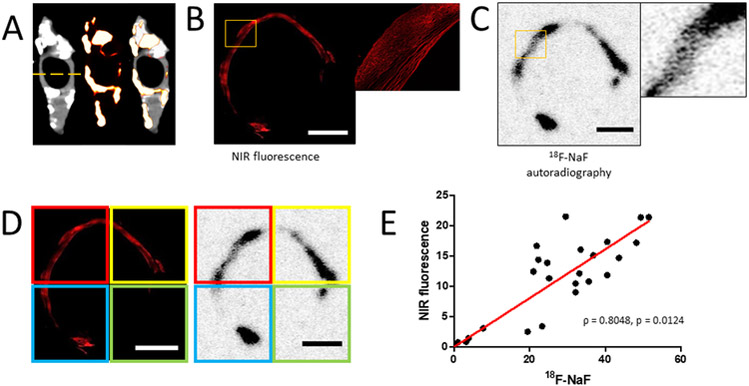
Figure 4. Quantitative histological analysis of PET-positive/CT-negative areas of carotid endarterectomy sample.
A, Location of section taken for histological analysis of carotid endarterectomy sample. B, Confocal microscopy imaging of carotid endarterectomy section after incubation with a NIRF calcium tracer (scale bar 2 mm). C, Autoradiography imaging of the same histological section after incubation with 18F-fluoride (scale bar 2 mm). D, Confocal and autoradiography images were divided into four quadrants and each quadrant of the images was quantified (scale bars 2 mm). E, Linear correlation between NIRF signal and 18F-fluoride autoradiography signal (Pearson R = 0.8048, p = 0.0124; n = 6 histological sections were analyzed).

