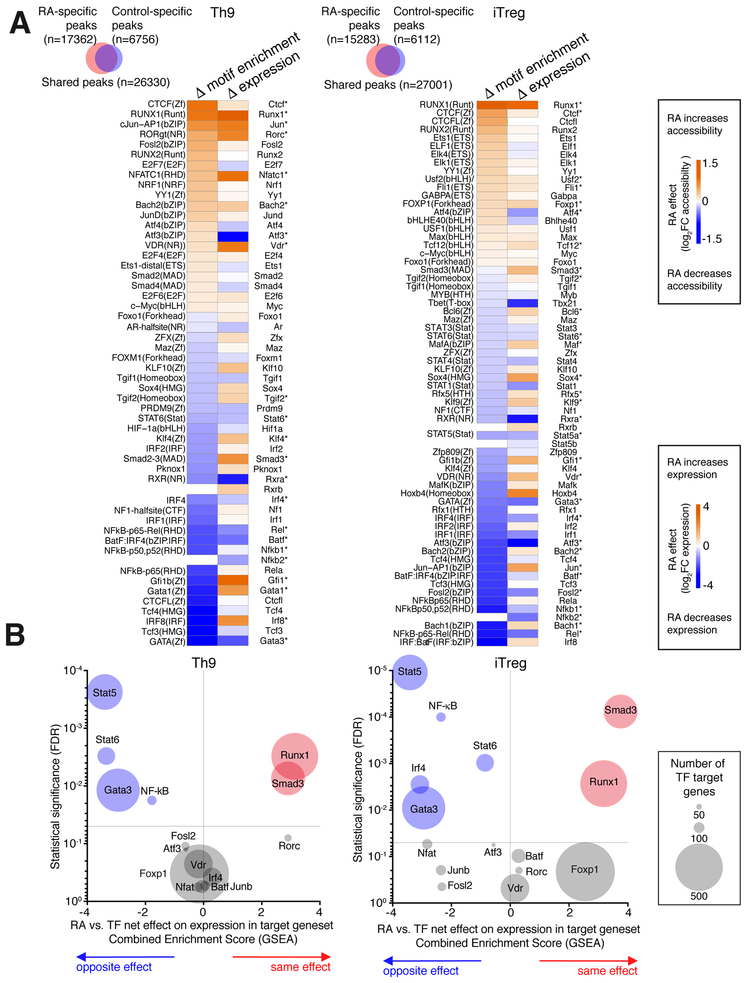
Figure 2. RA antagonizes Th9-promoting transcription factors (TFs).
A. TFs with RA-regulated motif accessibility and RA-regulated gene expression. Venn diagrams show changes in global genomic accessibility (number of ATAC peaks gained and lost) with RA treatment in Th9 and iTreg conditions. Heatmaps display RA effect on motif enrichment and gene expression for all TFs whose motif enrichment was significantly regulated by RA treatment. *FDR<0.05 B. RA effect on target genes of RA-regulated TFs. Enrichment plots display a combined Gene Set Enrichment Analysis (GSEA) enrichment score and FDR for the average, or net, effect of RA on target genesets for the following RA-regulated TFs: STAT5 (GSE77656); STAT6(GSE22801); GATA3(GSE20898); IRF4(GSE39756); NF-kB (Pahl, 1999); ATF3 (GSE61055); VDR(GSE2421); FOXP1(GSE50725); NFAT(GSE64409); JUNB (GSE98413); SMAD3(GSE19601), RUNX1(GSE6939); FOSL2, RORC, and BATF (GSE40918). A positive score (orange) indicates that RA has the same net effect as the TF on the target geneset, a negative score (blue) means that RA and the TF have the opposite net effect on the target geneset, and a neutral score indicates that RA has no consistent net effect on the geneset. The size of each data point corresponds to the size of the analyzed geneset. For full details of analysis see Supplementary Methods.

