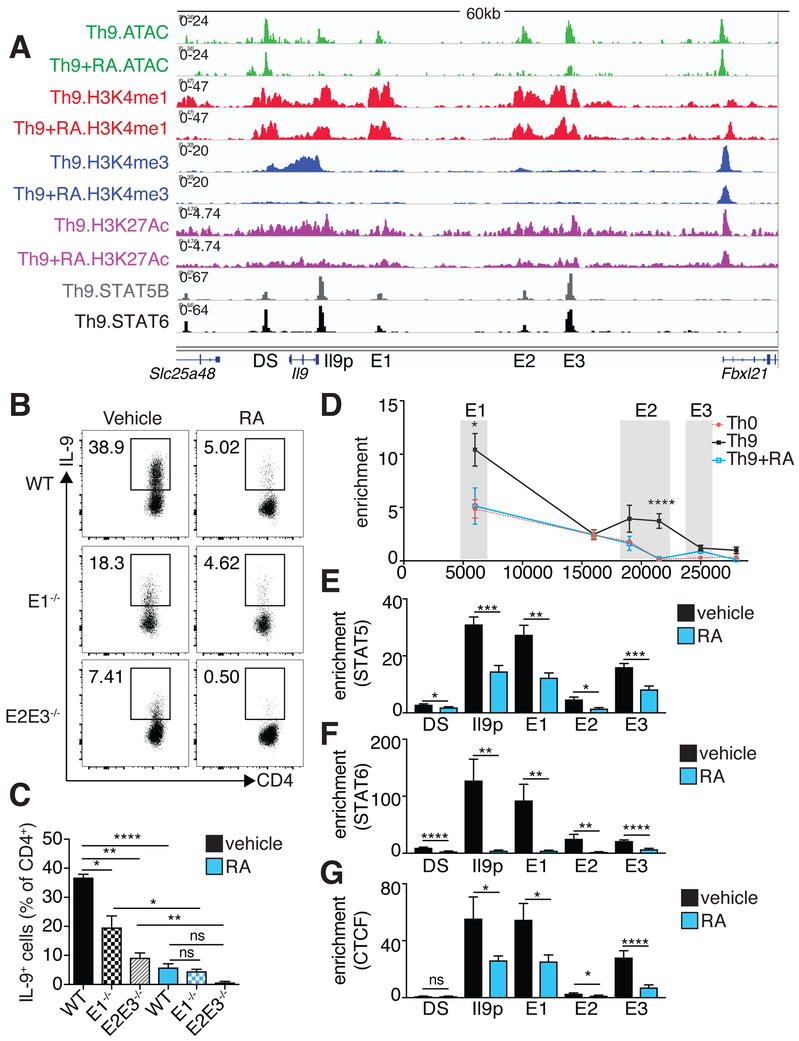
Figure 5. RA interferes with Il9 promoter-enhancer interaction and TF recruitment A. Il9 regulatory elements (REs) identified by histone epigenetic marks and chromatin accessibility, STAT5 and STAT6 binding sites within REs, and RA effect on REs.
Representative Il9 gene tracks of ATAC, H3K4M1, H3K4M3, and H3K27Ac in Th9 cells polarized in the presence of vehicle control or RA. 5 regulatory elements are marked: the Il9 promoter (Il9p), a downstream element (DS), and 3 upstream elements (E1–E3). E1–E3 and DS bear poised (H3K4M1) and active (H3K27Ac) enhancer marks, but not promoter (H3K4M3) marks (n=2). Gene tracks also show STAT5B and STAT6 binding sites in Th9 cells based on public data (GSE41317). B,C. Flow cytometric analysis of IL-9 expression in Th9 cells lacking different Il9 enhancers. B. A 3kb region containing E1 and an 8kb region containing E2–E3 were deleted to generate E1−/− and E2E3−/− mice, respectively. Flow cytometric plots show IL-9 expression in WT, E1−/−, and E2/E3−/− Th9 cells cultured with vehicle control or RA. C. Bar graph summarizing IL-9 expression (n=4). (data shown as mean ± SEM; *p<0.05,**p<0.01,****p<0.0001, paired t-test) D. Activation-dependent looping of extended Il9 locus, as measured by chromatin conformational capture (3C). Line graph depicts binding enrichment of distal regions to Il9 promoter. For Th0 cells, enrichment decreases with increased distance from the promoter. For Th9 cells, enrichment is elevated for E1, decreases for an inaccessible region between E1–E2, increases for E2, and decreases for E3. Treatment with RA reduces enrichment across the Il9 locus. Results are significant for Th9 vs. Th0 and Th9 vs. Th9+RA (n=5). E-G. ChIP-qPCR for STAT5, STAT6, and CTCF at Il9 regulatory elements in Th9 cells treated with vehicle control or RA. Bar graphs summarize binding enrichment for STAT5 (E), STAT6 (F), and CTCF (G) at the five Il9 regulatory elements, in Th9 cells cultured with vehicle control or RA (n=3). Pooled data shown as mean ± SEM; RA = 1000 nM; *p<0.05,**p<0.01,***p<0.005,****p<0.001, unpaired t-test. See also Figure S3.

