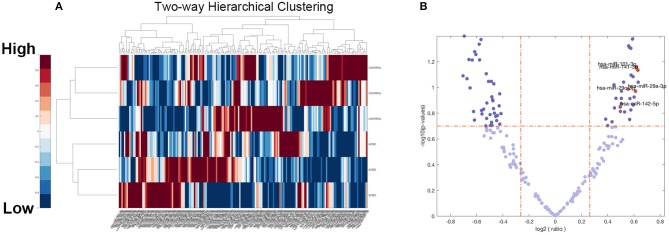
Figure 1.
Overview of miRNAs Sequencing Data from AOSD patients. (A) Volcano plot of the 482 miRNAs of 6 samples (3 AOSD and 3HCs). The abscissa represents log2 (fold change) of the miRNA expression while the ordinate represents the logarithmic transformation of the P-value gained by t-test. (B) Heat map with two-dimensional clustering of the imputed and normalized miRNA expression in the 6 samples. Missing data are intercepted before this procedure.

