Figure 2.
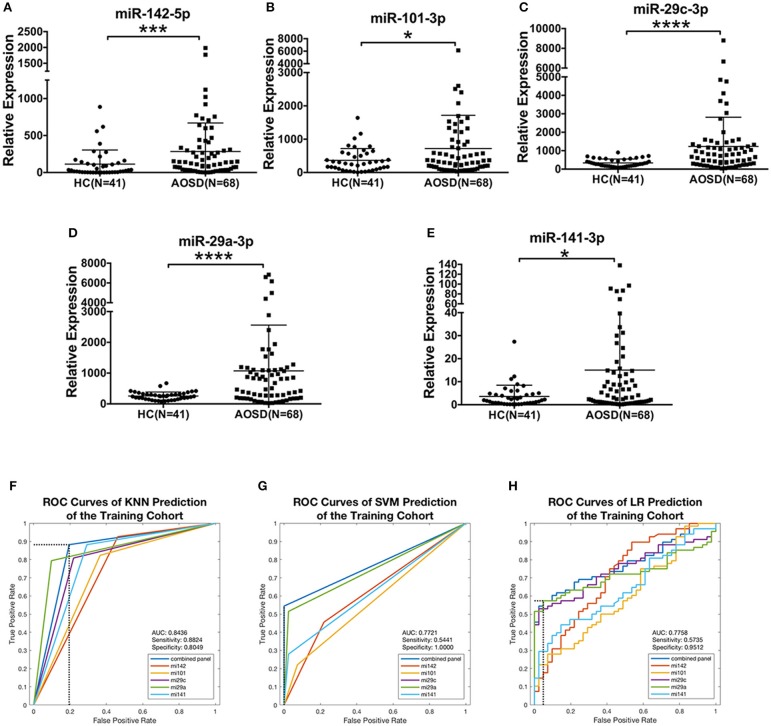
Differentially expressed plasma miRNAs signature for AOSD diagnosis in a training set. Expression levels of (A) miR-142-5p, (B) miR-101-3p, (C) miR-29c-3p, (D) miR-29a-3p, (E) miR-141-3p were analyzed by qRT-PCR in plasma from AOSD (N = 68) and HCs (N = 41). The results of histograms represent the means ± SD, *P < 0.05, ***P < 0.001, ****P < 0.0001. (F-H) ROC analysis for individual miRNAs and combined miRNA panel was analyzed by KNN (F), SVM (G), and LR (H) analysis.

