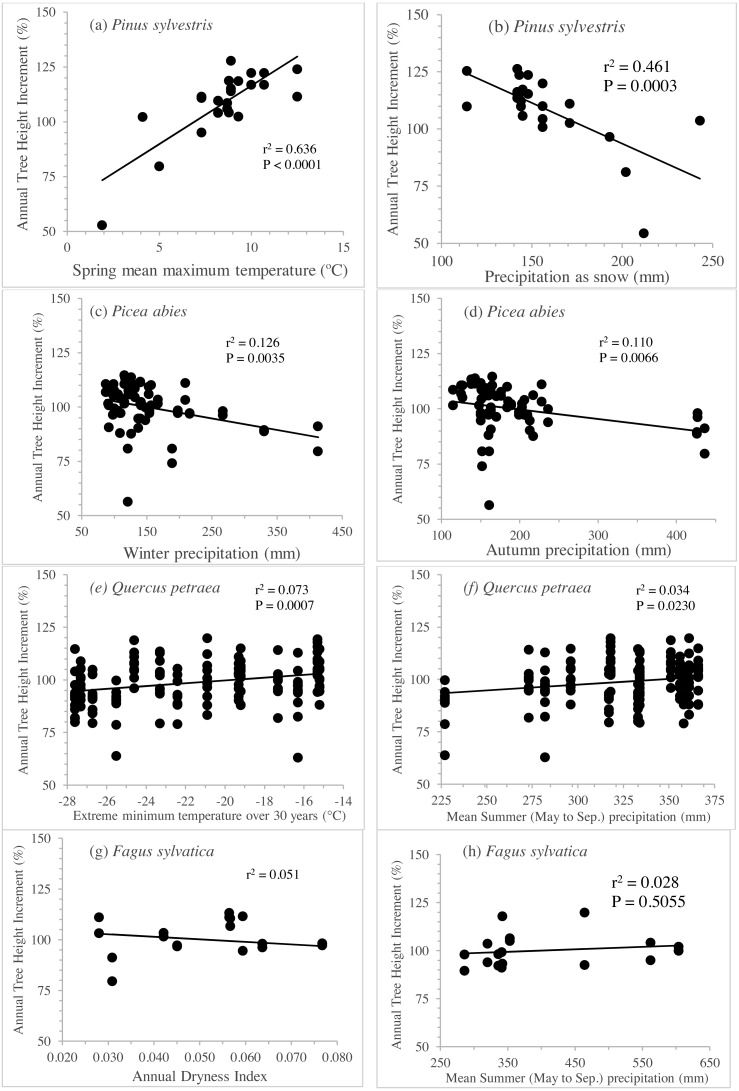
Figure 5. Clines per specie to illustrate genetic differentiation among populations.
Annual tree height increment (previously corrected by subtracting the site effect and standardized), regressed against the best three seed source climate variables per species, for Pinus sylvestris (A, B), Picea abies (C, D), Quercus petraea (E, F) and Fagus sylvatica (G, H). Estimations based only on “good” tests sites (with annual tree height increment average per site above the overall average).

