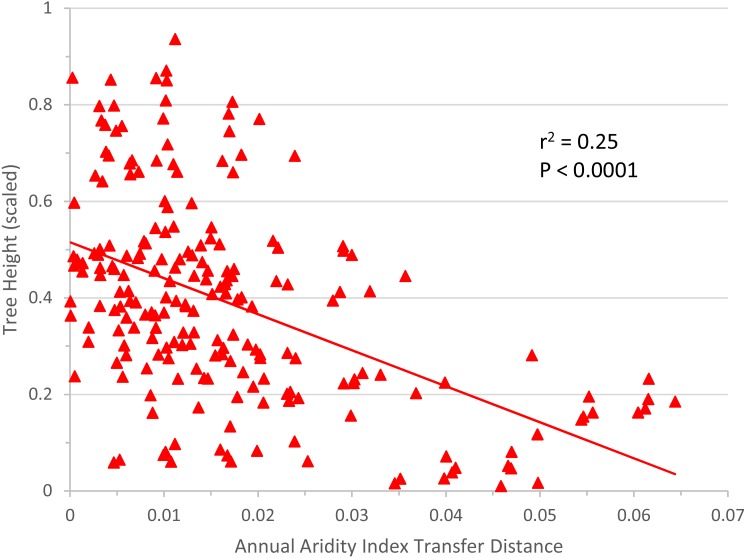
Figure 6. Response to transfer towards drier/warmer sites.
Unilateral linear regression of average tree height (scaled) for all populations and all sites vs. annual aridity index transfer distance for Q. petraea. Only data towards the warmer/drier site conditions, i.e., with transfer distance ≥ 0 were considered.

