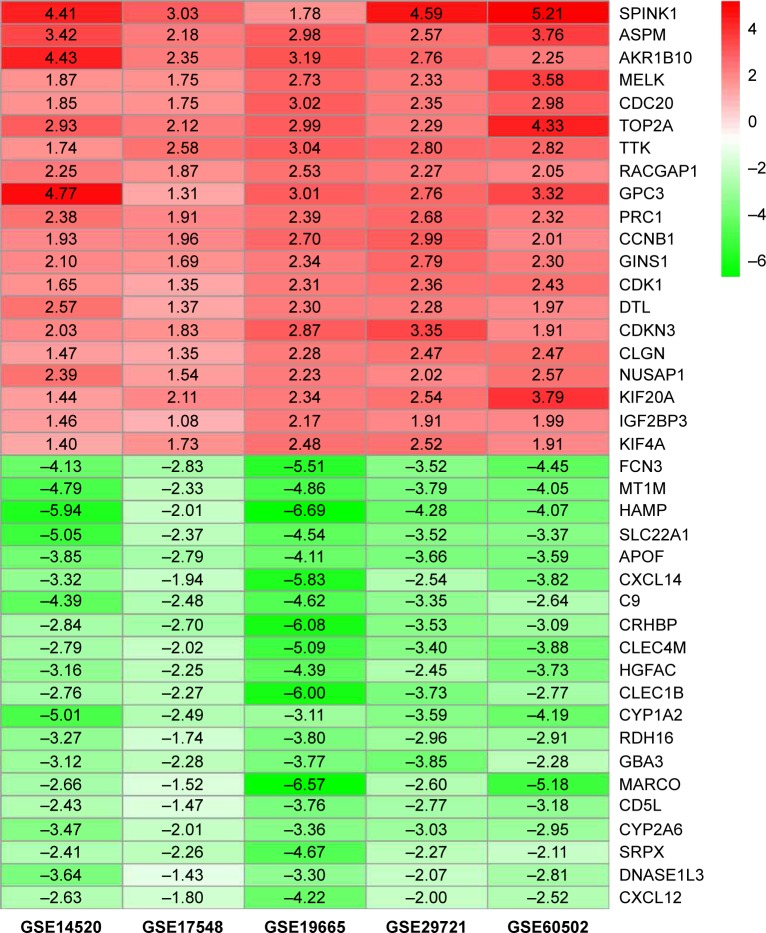
Figure 1.
Log2FC heat map of the top 20 upregulated and downregulated genes of the five expression-microarray groups downloaded from the GEO data set.
Notes: The differentially expressed gene (DEG) list of each expression microarray from the GEO data was integrated using R software with the RRA package. The abscissa is the GEO ID, and the ordinate is the gene name. Red represents upregulated gene expression, and green represents downregulated gene expression in hepatocellular carcinoma tissues compared with adjacent normal liver tissues. Numbers in the box represent log2FC values that resulted from the integrated analysis.
Abbreviations: FC, fold change; GEO, Gene Expression Omnibus; RRA, robust rank aggregation.

