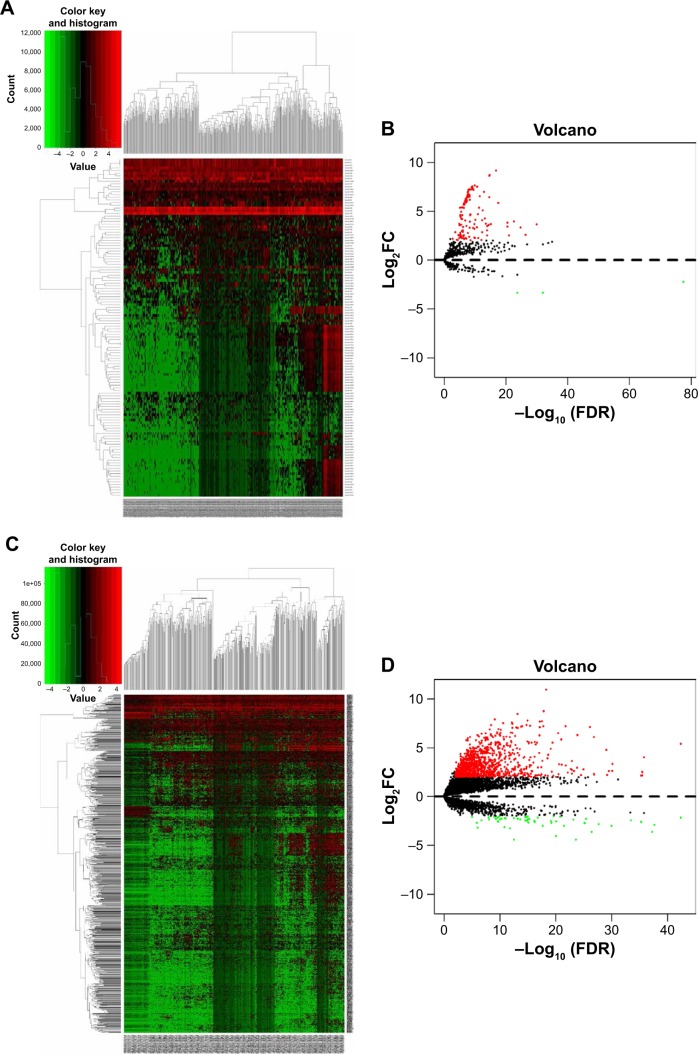
Figure 3.
Hierarchical clustering heat map and volcano plot of screened DEMs (A, B) and DELs (C, D) based on TCGA HCC WTS data.
Notes: miRNA- and lncRNA-expression data were downloaded and analyzed using R software and the Limma package. Log2FC >2 and P<0.01 were used as cutoff criteria.
Abbreviations: DEMs, differentially expressed miRNAs; DELs, differentially expressed lncRNAs; FC, fold change; TCGA, the Cancer Genome Atlas; HCC, hepatocellular carcinoma; WTS, whole-transcriptome sequencing.

