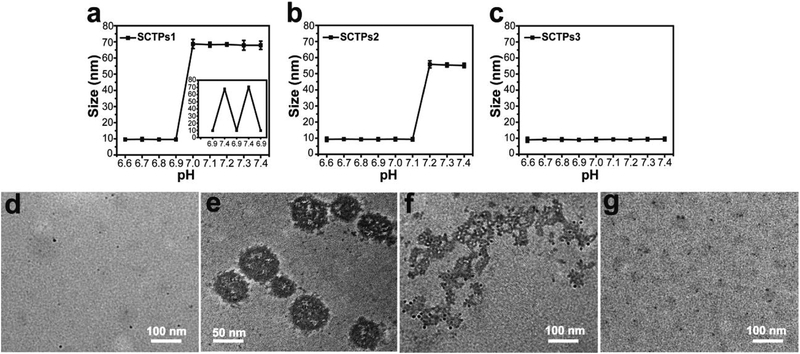
Fig. 1.
pH-dependent size change. (a) SCTPs1, the inset is the size variation of SCTPs1 with pH, (b) SCTPs2, and (c) SCTPs3 analysed by DLS. TEM of the assembly and dissociation, (d) SCTPs1, (e) MTAs, assembled by SCTPs1 at pH 7.4, (f) SCTPs1, dissociating from MTAs, and (g) complete dissociation at pH 6.9. TEM samples were stained with RuO4.

