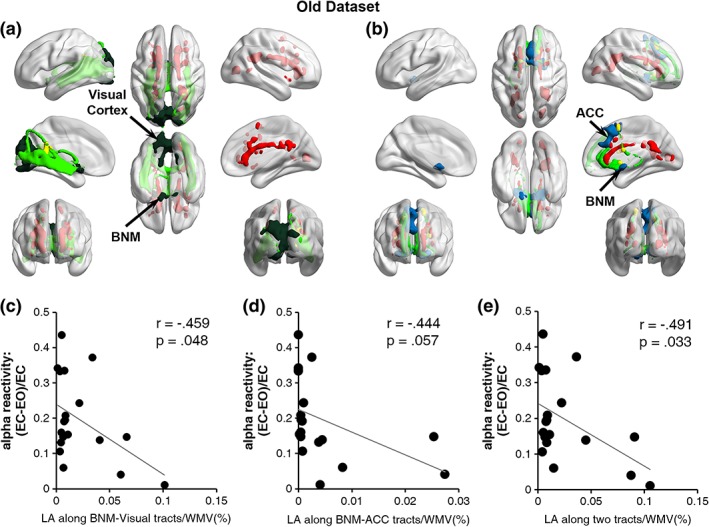
Figure 5.

LA and alpha reactivity for old adults. (a) LA distribution (red) along the fiber tracts from BNM (dark green) to visual cortex (dark green) for a sample subject. Red: LA distribution in the whole brain. Light green: Fiber tracts from BNM to visual cortex. (b) LA distribution (red) along the fiber tracts from BNM (blue) to ACC (blue) for a sample subject. Red: LA distribution in the whole brain. Light green: Fiber tracts from BNM to ACC. (c) Alpha reactivity was negatively correlated with LA volume along BNM‐visual fiber tracts. (d) Alpha reactivity was moderately correlated with LA volume along BNM‐ACC fiber tracts. (e) Sum of LA volume along BNM‐visual and BNM‐ACC fiber tracts was negatively correlated with alpha reactivity. WMV = white matter volume; ACC = anterior cingulate cortex [Color figure can be viewed at http://wileyonlinelibrary.com]
