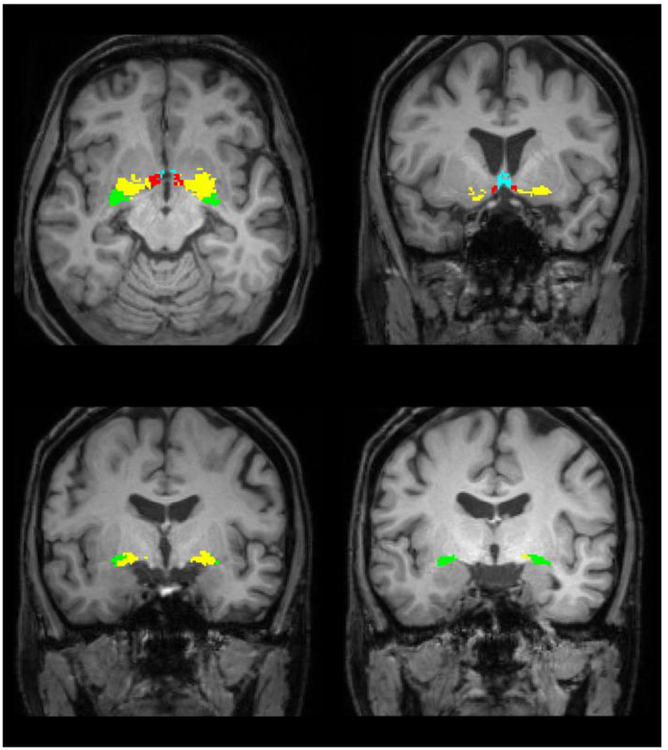
Fig. 1.
Location of the BFCS in one individual. The Ch1/2 region is displayed in blue, Ch3 in red. Ch4 is shown in yellow and Ch4p corresponds to the green area. We refer to a modified version of the Mesulam-nomenclature (Zaborszky et al., 2008). (For interpretation of the references to colour in this figure legend, the reader is referred to the web version of this article.)

