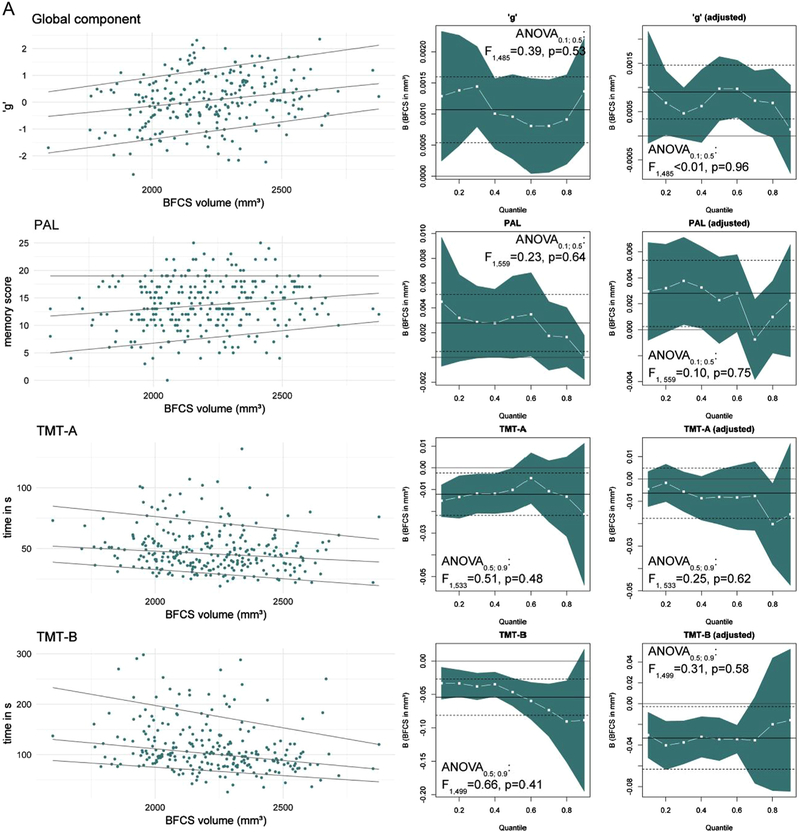
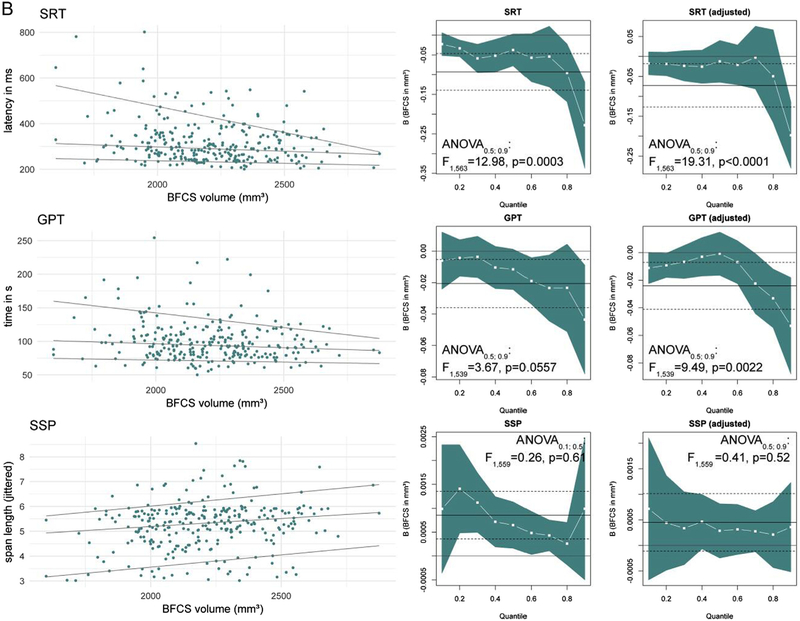
Fig. 5.
A: Quantile regression results of ‘g’ and test performance. The left column shows scatter plots with regression lines for the 0.1th, 0.5th (median) and 0.9th quantile. The columns on the right display quantile-coeffcient plots for simple (unadjusted, middle) and multiple quantile regression adjusting for age, sex and education (right). The regression coefficient for BFCS volume (white –■–) are displayed for each quantile (x-axis) with 95% CI (blue area). Solid and dashed lines mark the OLS regressions result with 95% CI. ANOVA results correspond to analysis for slope heterogeneity between median and lowest-performing quantile. (For interpretation of the references to colour in this figure legend, the reader is referred to the web version of this article.)


