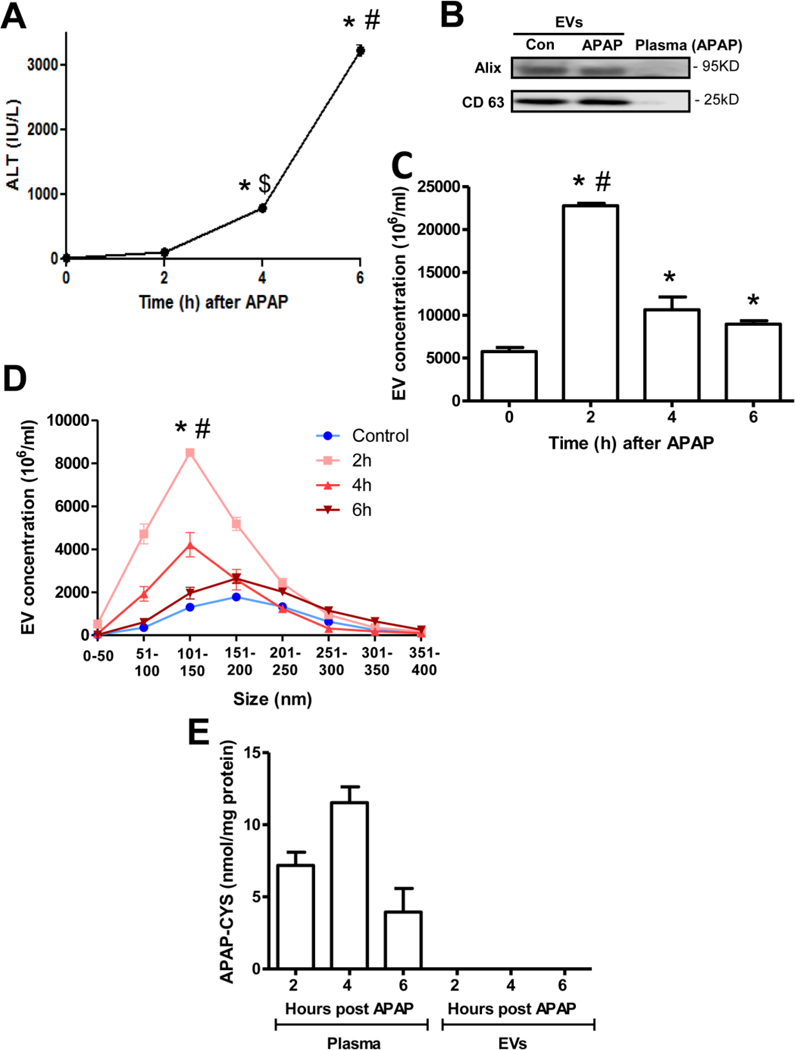
Figure 3: EV release into circulation after APAP overdose in mice in vivo.

Mice were treated with 300 mg/kg APAP and sacrificed at the indicated time points. (A) Plasma ALT levels as an indicator of liver injury after APAP overdose. (B) Western blotting showing enrichment of the EV markers Alix and CD63 in isolated plasma EVs from both control and APAP-treated mice at 2 h after APAP. (C) Total EV numbers before and after APAP treatment in vivo. (D) Size range of EVs isolated at various time points. (E) APAP-Cysteine adduct measurement in plasma and EV fractions at various time points after APAP. Values are mean ± SEM of n=3 animals per time point. *P<0.05 (compared to untreated controls), #P< 0.05 (compared to 4 or 6h time points), $P< 0.05 (compared to 2 h time point).
