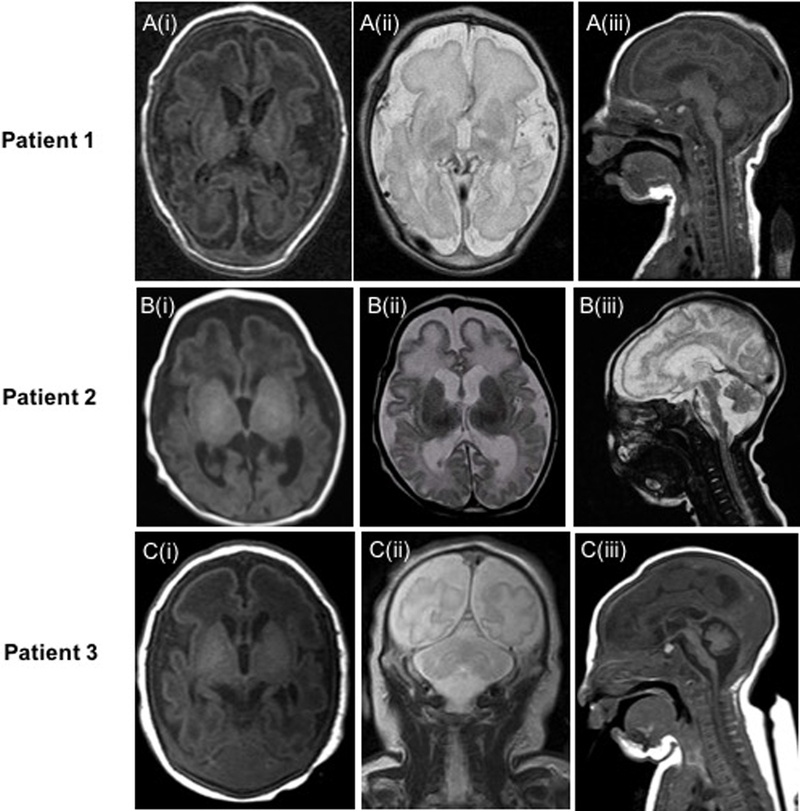
Figure 1:

(A) Brain magnetic resonance imaging (MRI) of patient 1 taken on day 2 of life. Axial T1 (i), axial T2 (ii) and sagittal T1 (iii) weighted images show microcephaly with overlapping of sutures, simplified gyral pattern, delayed myelination, reduced volume of the pons and mild cerebral atrophy are observed. (B) Brain MRI images of patient 2 taken at 1 month of age. Axial T1 (i), axial T2 (ii) and sagittal T2 (iii) weighed images show microcephaly with overlapping sutures, mild delayed myelination, reduced size of the pons and cerebral atrophy are observed. (C) Brain MRI images of patient 3 on day 2 of life. Axial T1 (i), coronal T2 (ii) and sagittal T1 (iii) weighted images show microcephaly with overlapping of sutures, simplified gyral pattern, reduced volume of the pons and cerebral atrophy are observed.
