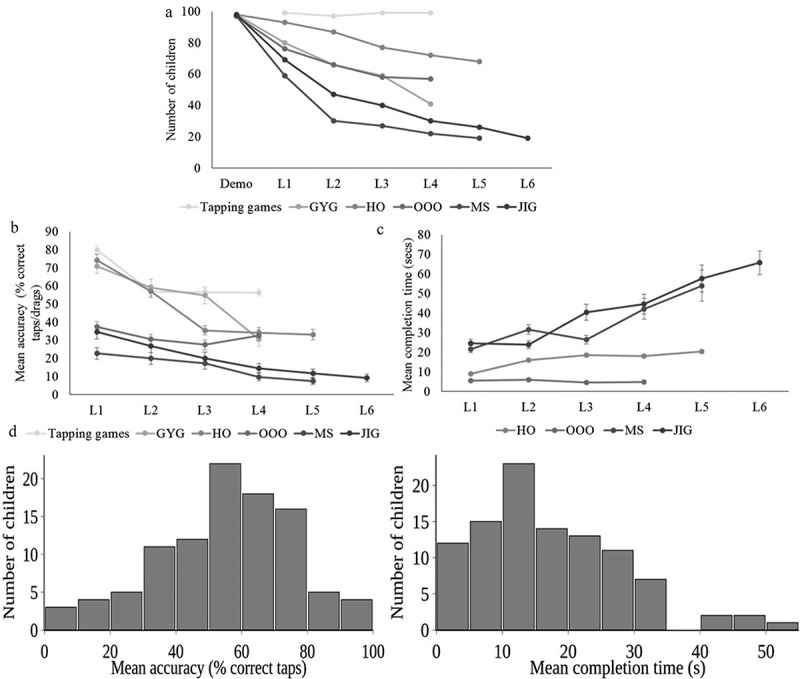
Figure 2.

Performance of children on beta version the games during pilot study (n = 100); L1-L6 represent increasing difficulty levels within each game. (a) Number of children reaching game levels for all games. LR is not represented since it was integrated within the narrative and thus all children played all levels; (b) Mean accuracy as percentage correct taps/drags across game levels (error bars are standard error means); (c) Mean completion time for HO, OOO, MS and JIG (error bars are standard error means). Data for ST, AT, PB and GYG is not represented (see results for reasons). (d) Histograms of accuracy and completion time in LR.
