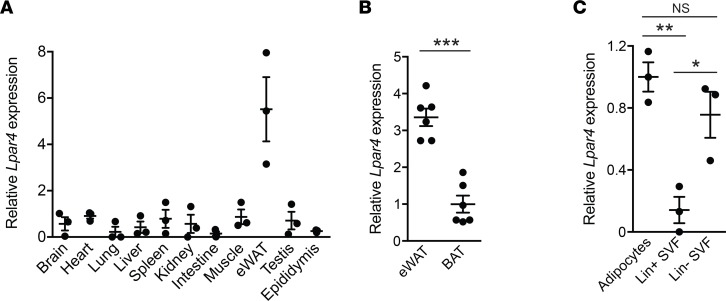
Figure 1. LPA4 expression levels in various tissues and fractions from adipose tissue.
(A) Mouse Lpar4 mRNA expression in various tissues (n = 3). (B) Comparison of mouse Lpar4 mRNA expression between epididymal white adipose tissue (eWAT) and brown adipose tissue (BAT) (n = 6). (C) Mouse Lpar4 mRNA expression in adipocytes, Lin+ and Lin– populations of the stromal vascular fraction (SVF) isolated from eWAT (n = 3). Each symbol represents an individual mouse. Data are expressed as the mean ± SEM. *P < 0.05, **P < 0.01, ***P < 0.001, unpaired Student’s t test (B) and 1-way ANOVA with Bonferroni’s post hoc test (C).

