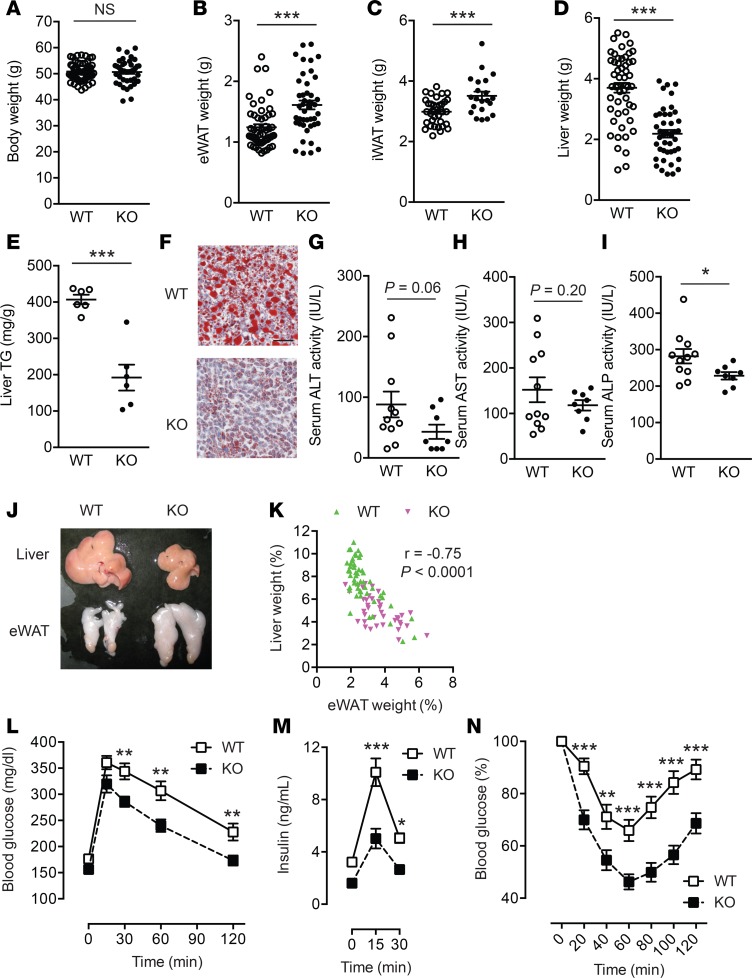
Figure 5. LPA4 ablation results in enhanced adipose tissue expandability and protection from hepatosteatosis and insulin resistance in a diet-induced obesity model.
(A–D) Whole body (A), epididymal white adipose tissue (eWAT) (B), inguinal WAT (iWAT) (C), and liver (D) weight of high-fat diet–fed (HFD-fed) WT (n = 42–52) and Lpar4-KO mice (n = 25–44). (E) Triglyceride (TG) content of the liver from HFD-fed WT and Lpar4-KO mice (n = 6 each). (F) Representative Oil Red O staining of liver sections from HFD-fed WT and Lpar4-KO mice. Scale bar: 100 μm. (G and I) Serum alanine transaminase (ALT) (G), aspartate transaminase (AST) (H), and alkaline phosphatase (ALP) (I) activities of HFD-fed WT and Lpar4-KO mice (n = 8–10). (J) A representative photograph of livers and eWATs from HFD-fed WT and Lpar4-KO mice. (K) Inverse correlation between eWAT and liver weight from HFD-fed WT (n = 52) and Lpar4-KO (n = 39) mice. (L–N) Blood glucose (L and N) and plasma insulin (M) levels of HFD-fed WT (n = 22–24) and Lpar4-KO (n = 20–21) mice during the oral glucose-tolerance test (L and M) and the insulin-tolerance test (N). Each symbol represents an individual mouse. Data are expressed as the mean ± SEM. *P < 0.05, **P < 0.01, ***P < 0.001; unpaired Student’s t test (A–E, G–I) or 1-way ANOVA with Bonferroni’s post hoc test (L–N) were used.

