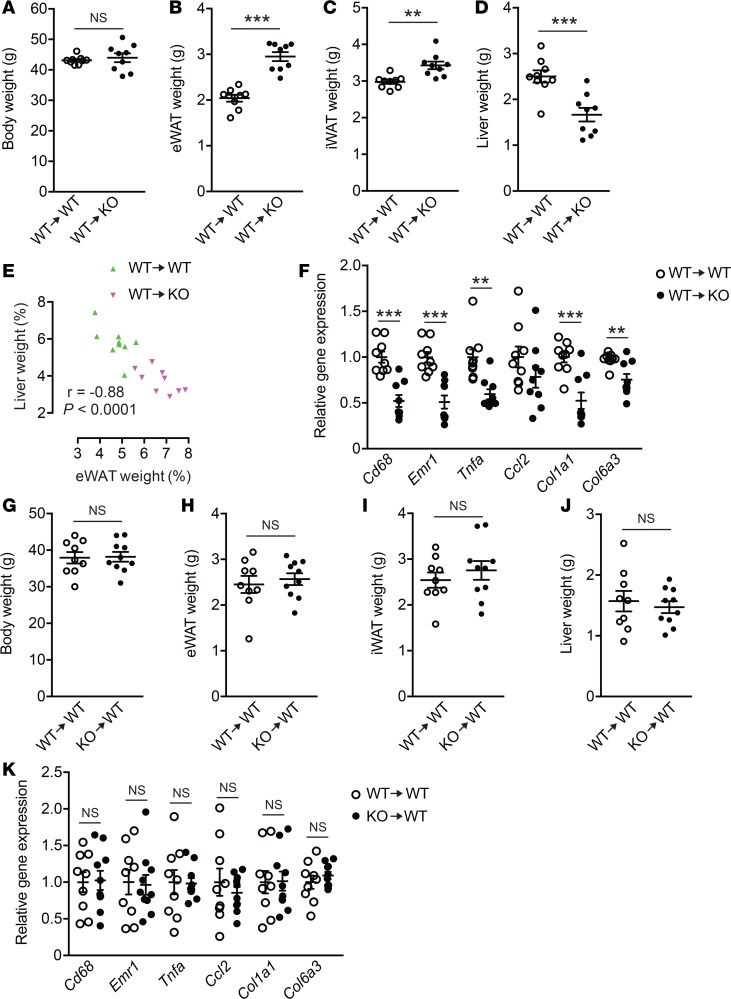
Figure 7. WT BM–reconstituted Lpar4-KO mice phenocopy the intact Lpar4-KO mice on high-fat diet (HFD).
(A–D) Whole body (A), epididymal white adipose tissue (eWAT) (B), inguinal WAT (iWAT) (C), and liver (D) weight of HFD-fed WT BM–reconstituted WT (WT→WT) and Lpar4-KO (WT→KO) mice (n = 9 each). (E) Inverse correlation between eWAT and liver weight from HFD-fed WT BM–reconstituted WT (WT→WT) and Lpar4-KO (WT→KO) mice (n = 9 each). (F) Relative mRNA expression of inflammation- or fibrosis-related genes in eWAT from HFD-fed WT BM–reconstituted WT (WT→WT) and Lpar4-KO (WT→KO) mice (n = 9 each). (G–J) Whole body (G), eWAT (H), iWAT (I), and liver (J) weight of HFD-fed WT and Lpar4-KO BM-reconstituted WT mice (WT→WT and KO→WT, respectively, n = 9–10). (K) Relative mRNA expression of inflammation- or fibrosis-related genes in eWAT from HFD-fed WT and Lpar4-KO BM-reconstituted WT mice (WT→WT and KO→WT, respectively, n = 9–10). Each symbol represents an individual mouse. Data are expressed as the mean ± SEM. **P < 0.01, ***P < 0.001, unpaired Student’s t test.

