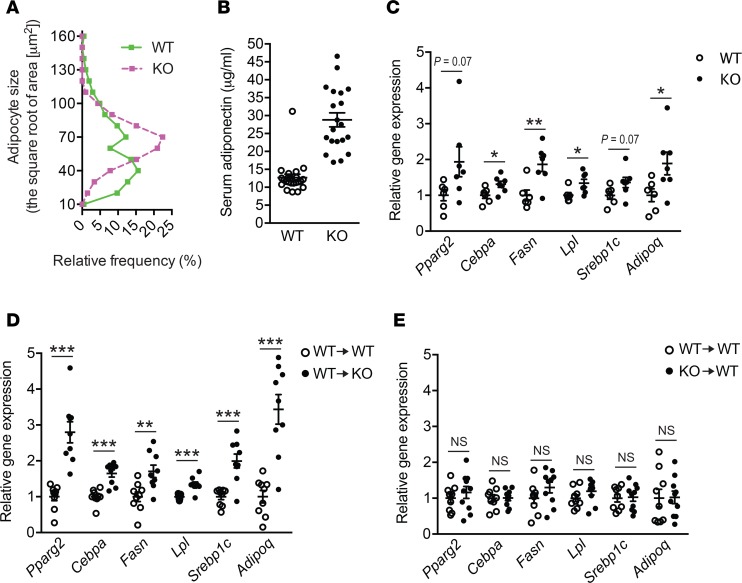
Figure 8. LPA4 inhibits continuous remodeling of adipose tissue in a diet-induced obesity model.
(A) Quantification of adipocyte size in epididymal white adipose tissue (eWAT) from high-fat diet–fed (HFD-fed) WT and Lpar4-KO mice. Representative histograms from 3 sections each are shown. (B) Serum adiponectin levels of HFD-fed WT (n = 22) and Lpar4-KO (n = 20) mice. (C) Relative mRNA expression of adipogenesis marker genes in eWAT from HFD-fed WT (n = 6) and Lpar4-KO mice (n = 7). (D) Relative mRNA expression of adipogenesis marker genes in eWAT from HFD-fed WT BM–reconstituted WT (WT→WT) and Lpar4-KO (WT→KO) mice (n = 9 each). (E) Relative mRNA expression of adipogenesis marker genes in eWAT from HFD-fed WT and Lpar4-KO BM-reconstituted WT mice (WT→WT and KO→WT, respectively, n = 9–10). Each symbol represents an individual mouse. Data are expressed as the mean ± SEM. *P < 0.05, **P < 0.01, ***P < 0.001, unpaired Student’s t test.

