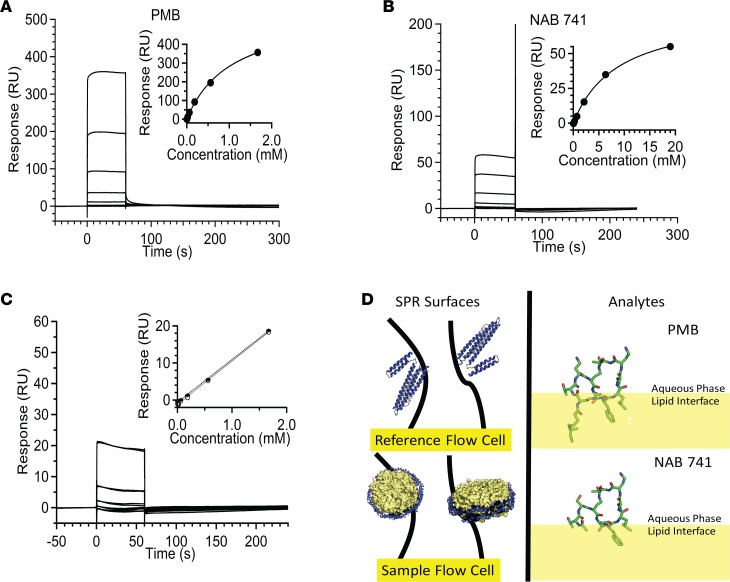
Figure 6. SPR experiments demonstrate high affinity and capacity of PMB–lipid nanodisc interactions.
(A) Binding data for PMB (2.3, 6.9, 20.6, 61.9, and 186.557.1670 μM) to nanodiscs. Equilibrium binding constant determined by fitting equilibrium responses to a steady-state binding model (inset). (B) Binding data for NAB741 (26, 78, 235.704.2111, 6,333, and 19,000 μM) to nanodiscs. Binding isotherm fit to a steady-state binding model for NAB741 (inset). (C) Representative sensorgrams showing overlapping duplicates. Linearity observed for equilibrium response data (duplicates), at lower concentrations (2.3, 6.9, 20.6, 61.9, 186.557.1670 μM) of NAB741 (dotted lines, inset). (D) Strategy for immobilization of 1-pal- mitoyl-2-oleoyl-sn-glycero-3-phosphocholine (POPC) lipid nanodiscs on sample flow cell surface and MSP1D1 (Protein Data Bank 2A01, depicted as lipid-free ApoA1 with N-terminal region in yellow) on the reference surface (left panel). Partitioning of PMB and NAB741 into the lipid bilayer determined by the Orientation of Proteins and Membranes database (https://opm.phar.umich.edu; OPM database). Conformation of NAB741 is based on PMB (Protein Data Bank 5L3F) and is not intended to be an exhaustive representation of conformers. Values are reported as the mean ± SD.

