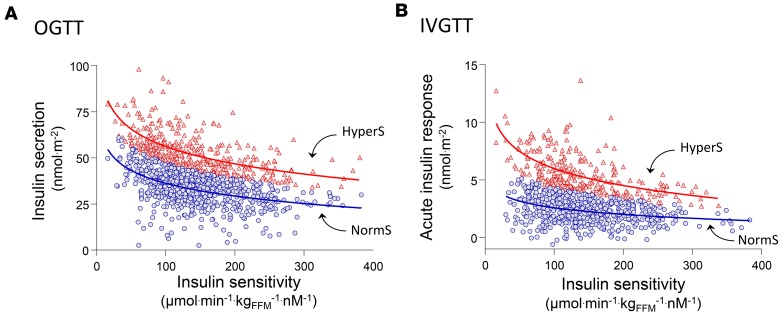
Figure 1. Identification of primary insulin hypersecretion.
(A) Relationship between total insulin secretion during a 75-g OGTT (ISROGTT) and insulin sensitivity (M/I) and in the RISC study cohort (n = 1,168). (B) Relationship between M/I and acute insulin response during an i.v. glucose tolerance test (AIRIVGTT) in the same cohort. Primary insulin hypersecretion was defined as either the ISROGTT or AIRIVGTT values in the upper tertile of the distribution of the residuals from the regression of log-linear data (ISROGTT = 99 – 12 ln[M/I], r = 0.43, P < 0.0001, and AIRIVGTT = 10 – 14 ln[M/I], r = 0.35, P < 0.0001, respectively). Using this cutoff, subjects were classified as hypersecretors (HyperS, red triangles; n = 389) or normosecretors (NormS, blue circles; n = 779).

