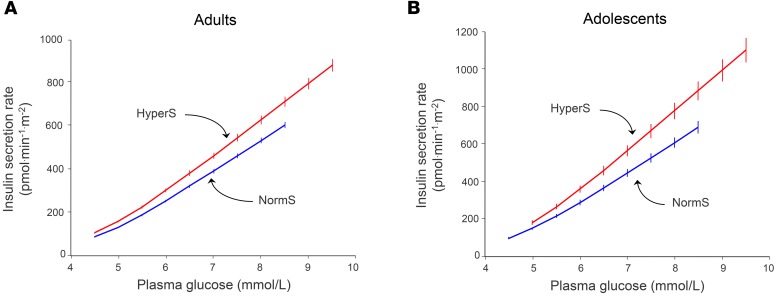
Figure 2. Dose-response of insulin secretion in adults and adolescents.
(A) Dose-response of insulin secretion rate during a 75-g OGTT in hypersecretors (HyperS, red line, n = 389) and normosecretors (NormS, blue line, n = 779) in the RISC study cohort. (B) Dose-response of insulin secretion rate during a 75-g OGTT in HyperS (n = 61) and NormS (n = 121) in the adolescent group. Note the steeper slopes of adolescents vs. adults.

