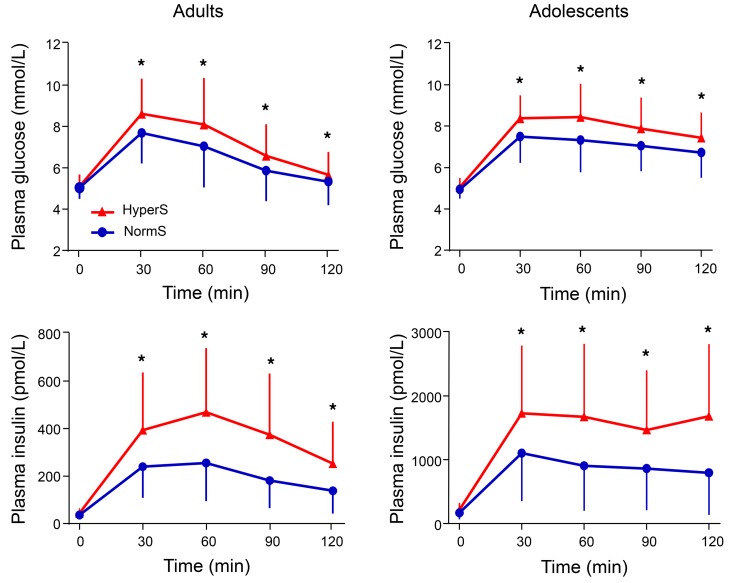
Figure 3. Plasma glucose and insulin concentrations during a 75-g OGTT in adults and adolescents.
Insulin hypersecretors (HyperS) are shown as red triangles (n = 389 in adults and n = 61 in adolescents), while normosecretors (NormS) are shown as blue circles (n = 779 in adults and n = 121 in adolescents). Repeated-measure ANOVA was performed including group (HyperS vs. NormS), time, and group × time interaction as factors, followed by post hoc pairwise comparisons using Tukey HSD tests. Plots are mean ± SD. Asterisks denote values that are significantly (*P ≤ 0.05) different between HyperS and NormS.

