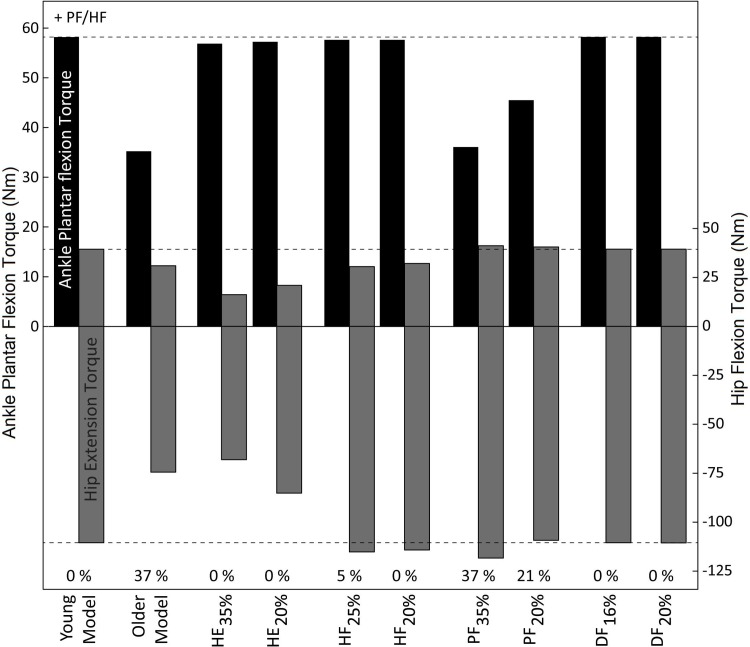
Fig 7. Peak joint torques at maximal platform displacement for young and older model, and all cases of strength loss.
The top of the bars indicate peak ankle plantar flexion/hip flexion torque, and the bottom of the bars indicate peak dorsiflexion/hip extension torque. The percentages at the bottom represent the percent reduction in maximal platform displacement compared to the young model.

