
Fig 1. Overall survival (OS) and local control (LC) curves stratified according to the best threshold for the clinical and radiomic features found to be significant at univariate analysis.
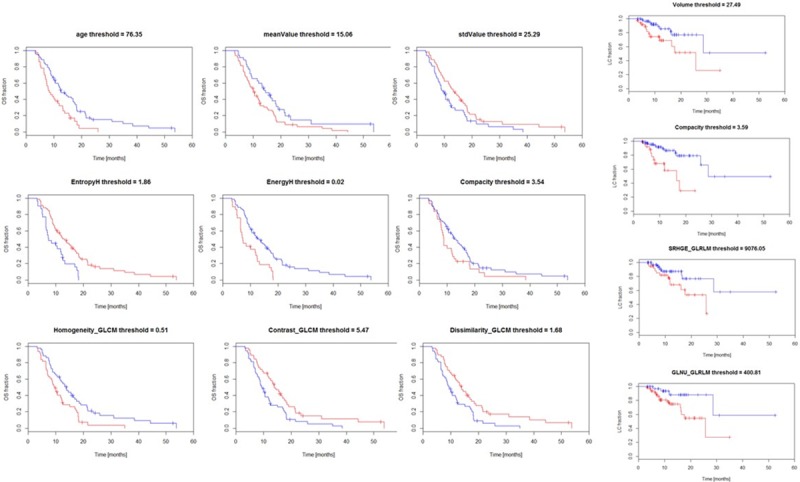
Data are shown for the training dataset. In the figures the blue lines correspond to the stratum above the threshold.