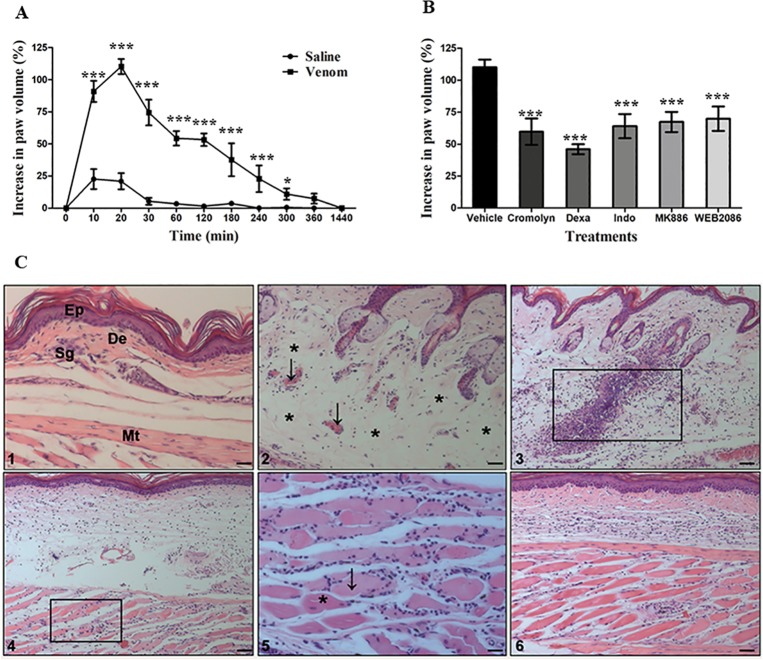
Fig 3. Local alterations induced by N. annulifera venom.
[A] Edema: samples of venom (10 μg/50 μL) or sterile saline were injected into the left or right hind footpad, respectively, of Balb/c mice (n = 6). Paw edema was assessed by measuring the paw thickness using a caliper rule before (T0) and after inoculation with venom or saline (Te). The increased paw volume was expressed as percentage (%) and was calculated with the following formula: (Te-T0)/T0*100. Statistical analysis was performed using two-way ANOVA, followed by the Bonferroni multiple comparison test (***p≤ 0.05) ± SD. [B] The effect of inhibitors on the paw edema induced by N. annulifera venom: groups of Balb/c mice (n = 6) were treated with different inhibitors before induction of edema with venom: Cromolyn, a mast cell degranulation inhibitor (10 mg/kg, three days consecutively before the edema, i.p. route); dexamethasone (Dexa), a cPLA2 inhibitor (2 mg/kg, 2 hours before the edema, i.p. route); indomethacin (Indo), a COX isoform inhibitor (10 mg/kg, 30 minutes before the edema, i.p. route); MK886, a 5-lipoxygenase-activating protein inhibitor (5 mg/kg, 30 minutes before the edema, i.p. route); and WEB2086, a PAFR antagonist (5 mg/kg, 1 hour before the edema, s.c. route). After treatment, edema was induced, and the paws were measured with a caliper rule at several time points. The increased paw volume was expressed as a percentage. Statistical analysis was performed using two-way ANOVA, followed by the Bonferroni multiple comparison test (***p≤ 0.05) ± SD. [C] Histopathological changes promoted by N. annulifera venom: samples of N. annulifera venom (10 μg/50 μL) were injected into the left hind paw of Balb/c mice (n = 6). The contralateral paws were injected with sterile saline (50 μL) to serve as controls. The animals were euthanized at different time points, and their paws were removed and submitted for histopathological analysis. Control group [Panel 1]: epidermis (Ep), dermis (De), sweat glands (Sg) and muscle tissue (Mt). Experimental group [Panel 2]: arrows highlight vascular congestion and a perivascular inflammatory infiltrate; asterisks indicate areas of edema. The rectangle indicates areas of neutrophil infiltration [Panel 3] and myonecrosis [Panels 4, 5]. The arrow and asterisk in Panel 5 indicate dead and living cells, respectively. Scale = 10μm.

