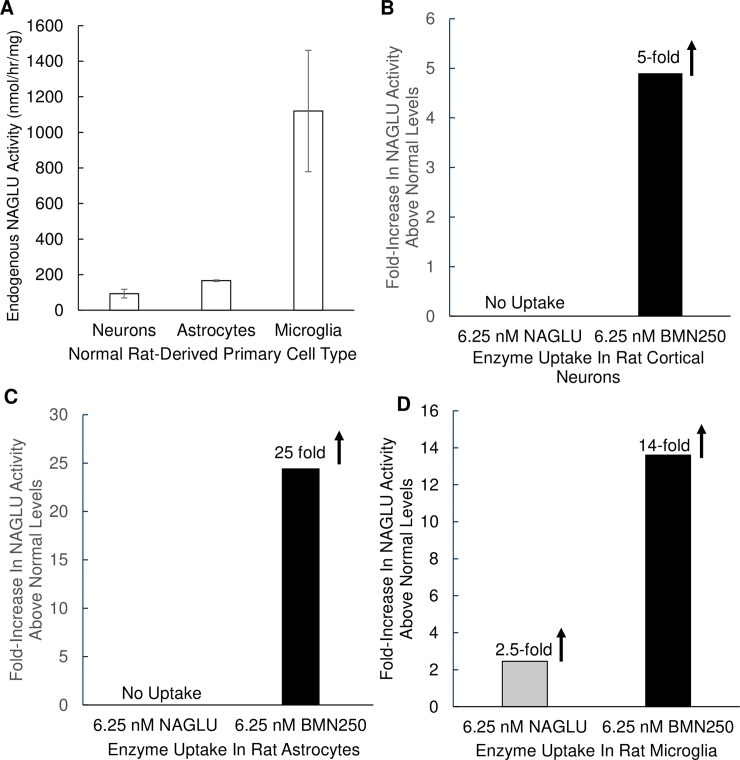
Fig 2. Evaluation of BMN 250 and rhNAGLU uptake in normal rat neurons, astrocytes and microglia.
A. Endogenous NAGLU activity levels present in normal rat-derived primary cortical neurons, astrocytes and microglia. To permit comparison between cell lines NAGLU activity levels present in cell lysates prepared from three separate cultures of each cell type was standardized to total protein levels and expressed as nmol/hr/mg total cell protein. Results are expressed as the mean (N = 3) ± SD. B, C, D. NAGLU activity levels present in normal rat-derived primary cultures of cortical neurons (A), astrocytes (B) and microglia (C) following 24 hours of cellular uptake with 6.25 nM BMN 250 (black bars) or 6.25 nM rhNAGLU (grey bars). NAGLU activity is presented as the fold-increase above normal endogenous levels of NAGLU activity in each cell line. Data sets for Fig 2 are shown in the Supporting information.

