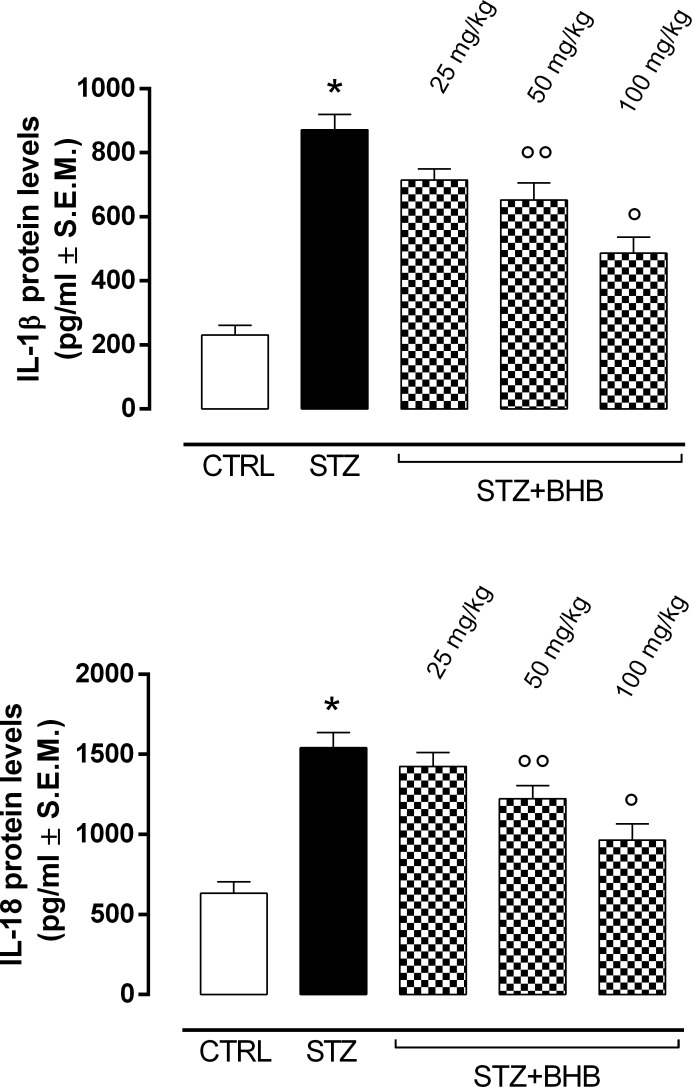
Fig 5. Proinflammatory cytokines IL-1β and IL-18 levels.
Determination of IL-1β and IL-18 levels by ELISA. Values are expressed as the mean of 10 observations ± S.E.M. CTRL = nondiabetic mice; STZ = diabetic mice; STZ+BHB = diabetic mice receiving BHB. *P < 0.01 vs CTRL; °°P < 0.05 vs STZ; °P <0.01 vs STZ.

