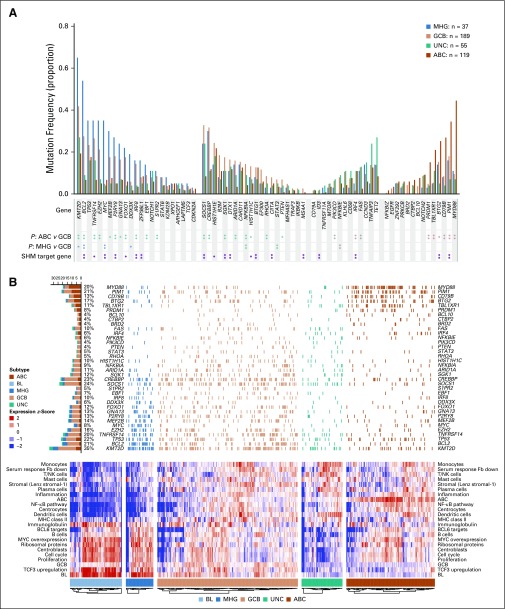
FIG 3.
Molecular characteristics of the molecular high-grade (MHG) group. (A) Mutation frequencies for 400 Randomized Evaluation of Molecular-Guided Therapy for Diffuse Large B-Cell Lymphoma With Bortezomib (REMoDL-B) patients in MHG, germinal center B-cell-like (GCB), unclassified (UNC), and activated B-cell-like (ABC) subgroups for the 70-gene panel (statistical significance of differences at P < .05 [single asterisks]) and P < .01 [double asterisks] by Fisher’s exact test). Known (double asterisks) and predicted (single asterisks) aberrant somatic hypermutation (SHM) target genes from Schmitz et al.6 (B) Heat map of gene expression signatures (bottom) and associated mutations (top; limited to genes with mutation frequency > 5% in at least one group and significantly different [P < .05] between any two groups of MHG, GCB, and ABC). The heat map shows the mean gene expression level (red = high to blue = low) over genes in the chosen signature cluster representative and is augmented in 70 patients with Burkitt lymphoma (BL) for comparison of gene expression patterns. The left-side bar chart (top) recapitulates the incidence of the corresponding mutations and their distribution among subgroups. Fb, fibroblast; NA, not applicable; NF-κB, nuclear factor kappa-light-chain-enhancer of activated B cell; NK, natural killer cell.

