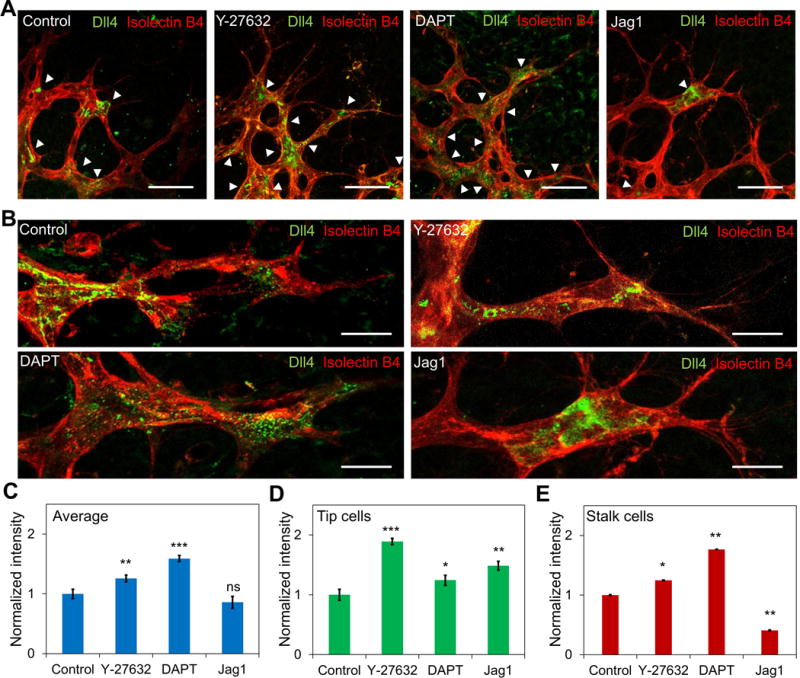
Figure 2. Inhibition of ROCK signaling modulates Dll4 expression in vivo.

(A) Dll4 distribution at the sprouting plexus margin. Whole-mounted retinas were stained with Isolectin B4 (red) and Dll4 (green). Mice were treated with Y-27632, DAPT, and Jag1 at P3, P4, P5, and P6. White arrow heads indicate Dll4 expressing cells. Scale bars, 50 μm. (B) Confocal images of Dll4 distribution in retinal sprouts with different treatments. Images are representative from three independent experiments. Scale bars, 20 μm. (C-E) Quantification of the average Dll4 expression in (C) the sprouts, (D) tip cells, and (E) stalk cells under different treatments. Data are expressed as mean ± s.e.m. (n = 5; ns, not significant; *P<0.05, **P<0.01, ***P<0.001; unpaired Student’s t-test).
