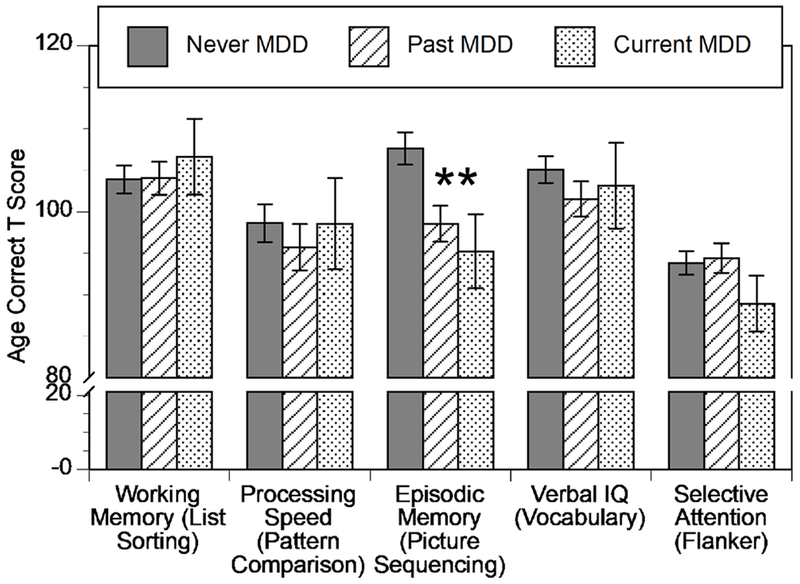
Figure 1: Depressive Disorder Group Differences on the NIH Toolbox.

Graph of mean and standard error for each of the five NIH Toolbox measures as a function of Depressive Disorder Group. Asterisks indicate significant differences among depressive disorder groups.
